June 2, 2016
VALUATION WATCH: Overvalued stocks now make up 47.35% of our stocks assigned a valuation and 13.6% of those equities are calculated to be overvalued by 20% or more. Eight sectors are calculated to be overvalued.
If you cannot display this bulletin properly, GO HERE
LUV Rules
--ValuEngine: Southwest Airlines Is Top S&P500 Stock
ValuEngine tracks more than 7000 US equities, ADRs, and foreign stock which trade on US exchanges as well as @1000 Canadian equities. When EPS estimates are available for a given equity, our model calculates a level of mispricing or valuation percentage for that equity based on earnings estimates and what the stock should be worth if the market were totally rational and efficient--an academic exercise to be sure, but one which allows for useful comparisons between equities, sectors, and industries. Using our Valuation Model, we can currently assign a VE valuation calculation to more than 2800 stocks in our US Universe.
We also use trading data to provide forecast estimates for a variety of time horizons for almost ever equity in our database. Our Buy/Sell/Hold recommendations are based upon the 1-year forecast return figure. Using valuation and forecast figures, you can rank and rate our covered stocks against each other, to find out, in an objective and systematic way, the most attractive investment targets based on your own risk/reward parameters. We re-calculate the entire database every trading day, so you are assured that every proprietary valuation and forecast datapoint is as up-to-date as possible.
We can use our data to track individual stocks, industries, sectors, and indices. For today's bulletin, we present key metrics for the top picks in the S&P 500. The companies listed below represent the top-ten BUY/STRONG BUY stocks within the index. They are presented below according to their one-month forecast target prices.
For June, we see a 50% turnover in our list. Traveler's has finally been dethroned from its longtime top spot by newcomer Southwest Airlines. DR Horton, Chubb, and AT&T also declined a few positions. Poultry giant Tyson has moved up while AIZ, AFL, HIG, AVGO, and KLAC have fallen out of the top-ten list. Other newcomers this week include Delta Airlines, Global Payments, UNUM Group, and First Solar.
Ticker |
Company Name |
Market Price |
Valuation |
Last 12-M Retrn |
1-M Forecast Retn |
1-Yr Forecast Retn |
P/E Ratio |
Sector Name |
Last Month Top Ten |
LUV |
SOUTHWEST AIR |
42.54 |
-12.64% |
12.39% |
1.25% |
15.08% |
10.92 |
Transportation |
TRV |
TRV |
TRAVELERS COS |
114.84 |
2.35% |
13.69% |
1.14% |
13.67% |
10.91 |
Finance |
DHI |
TSN |
TYSON FOODS A |
64.31 |
4.03% |
52.32% |
1.11% |
13.29% |
16.04 |
Consumer Staples |
AIZ |
DHI |
D R HORTON INC |
30.88 |
-0.23% |
16.79% |
1.05% |
12.63% |
13.91 |
Construction |
CB |
DAL |
DELTA AIR LINES |
43.51 |
-30.13% |
-1.89% |
1.03% |
12.37% |
7.38 |
Transportation |
TSN |
CB |
CHUBB LTD |
127.33 |
10.19% |
19.70% |
1.01% |
12.11% |
13.38 |
Finance |
T |
GPN |
GLOBAL PAYMENTS |
77.71 |
-41.99% |
48.39% |
0.98% |
11.80% |
26.25 |
Business Services |
AFL |
T |
AT&T INC |
38.73 |
0.50% |
12.75% |
0.97% |
11.67% |
13.83 |
Utilities |
HIG |
UNM |
UNUM GROUP |
36.75 |
1.43% |
5.09% |
0.97% |
11.65% |
9.84 |
Finance |
AVGO |
FSLR |
FIRST SOLAR INC |
50.07 |
-2.98% |
0.34% |
0.97% |
11.63% |
6.93 |
Oils-Energy |
KLAC |
NOTE: New stocks are in BOLD, old stocks that have moved up the list are in GREEN, old stocks that have declined in position are in RED, and stocks which have retained their position are in CAPS.
Below is today's data on our new SP500 leader, Southwest Airlines (LUV):
Southwest Airlines is a major domestic airline that provides primarily shorthaul, high-frequency, point-to-point, low-fare service. Southwest operates over Boeing 737 aircraft in numerous cities. Southwest has the lowest operating cost structure in the domestic airline industry and consistently offers the lowest and simplest fares. Southwest also has one of the best overall Customer Service records.
VALUENGINE RECOMMENDATION: ValuEngine continues its STRONG BUY recommendation on SOUTHWEST AIR for 2016-06-01. Based on the information we have gathered and our resulting research, we feel that SOUTHWEST AIR has the probability to OUTPERFORM average market performance for the next year. The company exhibits ATTRACTIVE Company Size and Sharpe Ratio.
You can download a free copy of detailed report on LUV from the link below.
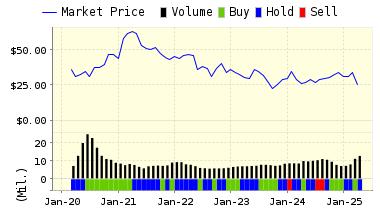
ValuEngine Forecast |
| |
Target
Price* |
Expected
Return |
1-Month |
43.07 |
1.25% |
3-Month |
43.40 |
2.02% |
6-Month |
43.22 |
1.60% |
1-Year |
48.96 |
15.08% |
2-Year |
41.64 |
-2.12% |
3-Year |
32.48 |
-23.65% |
Valuation & Rankings |
Valuation |
12.64% undervalued |
|
 70 70 |
1-M Forecast Return |
1.25% |
1-M Forecast Return Rank |
100 |
12-M Return |
12.39% |
|
81 |
Sharpe Ratio |
0.92 |
|
96 |
5-Y Avg Annual Return |
25.57% |
5-Y Avg Annual Rtn Rank |
96 |
Volatility |
27.81% |
|
62 |
Expected EPS Growth |
8.38% |
|
39 |
Market Cap (billions) |
28.87 |
Size Rank |
97 |
Trailing P/E Ratio |
10.92 |
|
88 |
Forward P/E Ratio |
10.07 |
Forward P/E Ratio Rank |
80 |
PEG Ratio |
1.30 |
PEG Ratio Rank |
35 |
Price/Sales |
1.43 |
|
55 |
Market/Book |
4.42 |
|
27 |
Beta |
1.02 |
Beta Rank |
44 |
Alpha |
0.14 |
Alpha Rank |
83 |

DOWNLOAD A FREE SAMPLE OF OUR SOUTHWEST (LUV) REPORT BY CLICKING HERE
ValuEngine Market Overview
Summary of VE Stock Universe |
Stocks Undervalued |
52.65% |
Stocks Overvalued |
47.35% |
Stocks Undervalued by 20% |
22.79% |
Stocks Overvalued by 20% |
14.93% |
ValuEngine Sector Overview
|
|
|
|
|
|
|
|
0.62% |
0.65% |
5.55% |
6.34% overvalued |
2.75% |
23.55 |
|
-0.15% |
-0.10% |
5.88% |
5.53% overvalued |
-1.07% |
22.91 |
|
0.46% |
0.57% |
11.76% |
4.85% overvalued |
-33.49% |
23.77 |
|
0.01% |
0.05% |
4.53% |
4.68% overvalued |
-10.33% |
18.05 |
|
-0.15% |
-0.12% |
26.37% |
4.52% overvalued |
8.74% |
29.33 |
|
0.24% |
0.28% |
6.05% |
2.90% overvalued |
-10.12% |
21.49 |
|
0.19% |
0.25% |
-2.19% |
1.04% overvalued |
-4.84% |
18.75 |
|
0.31% |
0.39% |
7.66% |
0.25% overvalued |
-8.92% |
27.89 |
|
0.40% |
0.46% |
11.99% |
0.55% undervalued |
-8.49% |
22.99 |
|
0.15% |
0.19% |
2.41% |
0.90% undervalued |
-4.84% |
16.00 |
|
0.38% |
0.42% |
2.93% |
1.34% undervalued |
-10.90% |
22.67 |
|
-0.20% |
-0.15% |
20.93% |
2.03% undervalued |
-4.46% |
20.52 |
|
0.68% |
0.79% |
-4.65% |
3.59% undervalued |
-19.52% |
27.12 |
|
-0.30% |
-0.27% |
-0.53% |
8.15% undervalued |
-17.51% |
11.90 |
|
-0.20% |
-0.16% |
1.60% |
8.80% undervalued |
-28.23% |
13.62 |
|
0.23% |
0.29% |
-3.38% |
11.04% undervalued |
-11.71% |
21.97 |
ValuEngine.com is an independent research provider, producing buy/hold/sell recommendations, target price, and valuations on over 7,000 US and Canadian equities every trading day.
Visit www.ValuEngine.com for more information

|


