August 2, 2016
VALUATION WATCH: Overvalued stocks now make up 45.34% of our stocks assigned a valuation and 13.85% of those equities are calculated to be overvalued by 20% or more. Six sectors are calculated to be overvalued.
If you cannot display this bulletin properly, GO HERE
Summer Doldrums Or Something More?
US Auto Sales Flat For July
Preliminary sales data indicates that the boom times for auto manufacturers may have peaked and they are now in a plateau phase.
"Low interest rates, longer loan terms and increased leasing are helping consumers afford their monthly payments, which would be upwards of $550 per month on a traditional 60-month term," said Tim Fleming, analyst for Kelley Blue Book. "As the price gap to late-model used cars increases, more shoppers may turn to the pre-owned market for their next vehicle, which could mark a big departure from the new-car sales growth the industry has seen during the past five years."
Year-over-year sales for big manufacturers increased, but month-to-month figures did not grow substantially. Ford saw a decline of 3%. GM saw a decline of 1.9%. Fiat/Chrysler managed to eke out a slight increase of 0.3%. Nissan reported gains of 1.2%. Honda saw an increase of 4.4%. Toyota reported a decline of 1.4%.
In many cases, the sales figures showed that while trucks were increasing, an overall lower rate of car sales hampered the major manufacturers. This has led to increased concern that sales overall are slowing and starting to plateau. Of course, we have seen many sales records set since the end of the great Recession of 2008, and any pull back from records may not be indicative of trouble for the industry as a whole.
The release of the latest figures triggered some selling in the sector. Ford, GM, and Chrysler were all down as of this writing.
When we query our systems for the auto industry today, we find the following data on the firms discussed above and a few other top companies. Complete data, including BUY/SELL/HOLD recommendations, are available at ValuEngine.com. Members can always screen for these stocks using our advanced screening page HERE.
Ticker |
Company Name |
Market Price |
Valuation |
Last 12-M Retrn |
1-M Forecast Retn |
1-Yr Forecast Retn |
P/E Ratio |
Country Code |
DDAIF |
DAIMLER AG |
67.55 |
-20.64% |
-24.69% |
0.01% |
0.07% |
7.61 |
DEU |
FCAU |
FIAT CHRYSLER |
6.33 |
N/A |
-60.78% |
-0.29% |
-3.52% |
3.20 |
GBR |
F |
FORD MOTOR CO |
12.48 |
-12.87% |
-16.47% |
0.10% |
1.19% |
5.67 |
USA |
GM |
GENERAL MOTORS |
31.3 |
-15.26% |
-1.20% |
0.60% |
7.15% |
5.22 |
USA |
HMC |
HONDA MOTOR |
27.29 |
-13.35% |
-21.22% |
-0.26% |
-3.16% |
19.49 |
JPN |
ISUZY |
ISUZU MOTORS |
12.815 |
N/A |
-6.80% |
0.16% |
1.89% |
11.25 |
JPN |
NSANY |
NISSAN ADR |
19.67 |
-6.90% |
3.80% |
0.71% |
8.55% |
7.62 |
JPN |
TSLA |
TESLA MOTORS |
230.01 |
-75.00% |
-11.53% |
-0.25% |
-3.04% |
N/A |
USA |
TM |
TOYOTA MOTOR CP |
111.23 |
1.80% |
-16.48% |
-0.12% |
-1.45% |
10.09 |
JPN |
VLKAY |
VOLKSWAGEN-ADR |
29.3 |
N/A |
-27.65% |
-0.59% |
-7.14% |
128.79 |
DEU |
Here Is complete data on one of our top Auto stocks:|
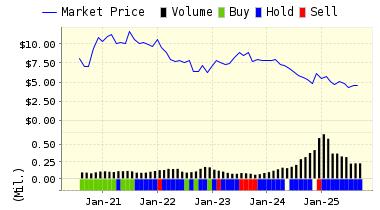
Nissan Motor Company, Ltd. (NSANY) manufactures and markets motor vehicles and parts. In North America, Nissan's operations include styling, engineering, manufacturing, sales, customer and corporate finance and industrial and textile equipment. Nissan in North America employs more than 20,000 people in the United States, Canada and Mexico and generates nearly 75,000 jobs through its 1,500 Nissan and Infinity dealerships across the continent.
ValuEngine continues its BUY recommendation on NISSAN ADR for 2016-08-01. Based on the information we have gathered and our resulting research, we feel that NISSAN ADR has the probability to OUTPERFORM average market performance for the next year. The company exhibits ATTRACTIVE Company Size and P/E Ratio.
You can download a free copy of detailed report on Nissan from the link below.
ValuEngine Forecast |
| |
Target
Price* |
Expected
Return |
1-Month |
19.81 |
0.71% |
3-Month |
20.11 |
2.22% |
6-Month |
20.23 |
2.85% |
1-Year |
21.35 |
8.55% |
2-Year |
21.24 |
7.97% |
3-Year |
19.50 |
-0.89% |
Valuation & Rankings |
Valuation |
6.90% undervalued |
|
 59 59 |
1-M Forecast Return |
0.71% |
1-M Forecast Return Rank |
92 |
12-M Return |
3.80% |
|
63 |
Sharpe Ratio |
-0.08 |
|
47 |
5-Y Avg Annual Return |
-1.85% |
5-Y Avg Annual Rtn Rank |
48 |
Volatility |
23.00% |
|
69 |
Expected EPS Growth |
-4.65% |
|
17 |
Market Cap (billions) |
44.46 |
Size Rank |
98 |
Trailing P/E Ratio |
7.62 |
|
95 |
Forward P/E Ratio |
8.00 |
Forward P/E Ratio Rank |
90 |
PEG Ratio |
n/a |
PEG Ratio Rank |
n/a |
Price/Sales |
0.44 |
|
84 |
Market/Book |
1.07 |
|
74 |
Beta |
0.94 |
Beta Rank |
49 |
Alpha |
-0.03 |
Alpha Rank |
49 |

DOWNLOAD A FREE SAMPLE OF OUR NISSAN (NSANY) REPORT BY CLICKING HERE
ValuEngine Market Overview
Summary of VE Stock Universe |
Stocks Undervalued |
54.66% |
Stocks Overvalued |
45.34% |
Stocks Undervalued by 20% |
23.32% |
Stocks Overvalued by 20% |
13.85% |
ValuEngine Sector Overview
|
|
|
|
|
|
|
|
-4.88% |
-3.79% |
49.48% |
17.38% overvalued |
56.86% |
31.31 |
|
-1.66% |
-1.27% |
7.71% |
7.46% overvalued |
8.98% |
24.43 |
|
-1.53% |
-1.27% |
12.45% |
5.83% overvalued |
11.77% |
23.62 |
|
-2.27% |
-1.62% |
5.18% |
3.31% overvalued |
-6.81% |
18.68 |
|
-3.03% |
-2.31% |
10.52% |
0.99% overvalued |
3.93% |
22.34 |
|
-0.53% |
-0.36% |
-3.14% |
0.00% undervalued |
-4.11% |
19.28 |
|
-1.13% |
-0.76% |
11.52% |
1.09% undervalued |
1.60% |
29.85 |
|
-2.20% |
-1.69% |
13.83% |
1.50% undervalued |
-4.52% |
22.91 |
|
-2.73% |
-2.04% |
28.47% |
1.57% undervalued |
7.25% |
21.97 |
|
-1.52% |
-1.14% |
3.86% |
2.34% undervalued |
-0.32% |
16.45 |
|
-1.22% |
-0.91% |
6.11% |
3.55% undervalued |
-4.40% |
22.66 |
|
-5.20% |
-4.36% |
16.16% |
4.42% undervalued |
-17.52% |
24.31 |
|
-0.77% |
-0.51% |
0.87% |
8.39% undervalued |
-20.15% |
28.35 |
|
-2.47% |
-1.79% |
-0.27% |
8.72% undervalued |
-6.29% |
22.32 |
|
-1.62% |
-1.21% |
7.83% |
8.82% undervalued |
-21.60% |
14.58 |
|
-1.14% |
-0.98% |
2.04% |
14.85% undervalued |
-5.21% |
12.74 |
ValuEngine.com is an independent research provider, producing buy/hold/sell recommendations, target price, and valuations on over 7,000 US and Canadian equities every trading day.
Visit www.ValuEngine.com for more information

|


