October 13, 2016
VALUATION WATCH: Overvalued stocks now make up 47.11% of our stocks assigned a valuation and 15.38% of those equities are calculated to be overvalued by 20% or more. Seven sectors are calculated to be overvalued.
If you cannot display this bulletin properly, GO HERE
Indexing
--ValuEngine: DOW Top-Ten List Remains Static
ValuEngine tracks more than 7000 US equities, ADRs, and foreign stock which trade on US exchanges as well as @1000 Canadian equities. When EPS estimates are available for a given equity, our model calculates a level of mispricing or valuation percentage for that equity based on earnings estimates and what the stock should be worth if the market were totally rational and efficient--an academic exercise to be sure, but one which allows for useful comparisons between equities, sectors, and industries. Using our Valuation Model, we can currently assign a VE valuation calculation to more than 2800 stocks in our US Universe.
We also use trading data to provide forecast estimates for a variety of time horizons for almost ever equity in our database. Our Buy/Sell/Hold recommendations are based upon the 1-year forecast return figure. Using valuation and forecast figures, you can rank and rate our covered stocks against each other, to find out, in an objective and systematic way, the most attractive investment targets based on your own risk/reward parameters. We re-calculate the entire database every trading day, so you are assured that every proprietary valuation and forecast datapoint is as up-to-date as possible.
We can use our data to track individual stocks, industries, sectors, and indices. For today's bulletin, we present key metrics for the top picks in the Dow Jones Industrials. The companies listed below represent the top stocks within the index. They are presented below according to their one-month forecast gain.
When we look at our DOW top-ten list lately, two things are true; we typically see very little turnover, and Verizon is number one. This month is no different. Since we last presented the top Dow picks on September 8th, we have just one new company in our list, and VZ remains ensconced in the first spot.
JPMorgan Chase is our sole newcomer this month, DuPont has held its ninth spot. United Technologies has fallen out of the top ten. Intel, Traveler's, Johnson and Johnson, and Merck have moved up a few spots. At the same time, Cisco, United Health, and IBM have declined to make room for the climbers.
Also, be advised that we have no STRONG BUY-rated stocks in the DOW right now. JPMorgan Chase, United Health, DuPont, and IBM are NOT ranked BUY, they are all currently rated as HOLDs by our models.
Ticker |
Company Name |
Market Price |
Valuation |
Last 12-M Retrn |
1-M Forecast Retn |
1-Yr Forecast Retn |
P/E Ratio |
Sector Name |
Sept. 8th, 2016 |
VZ |
VERIZON COMM |
50.3 |
-4.45% |
13.54% |
0.75% |
9.03% |
12.93 |
Utilities |
VZ |
INTC |
INTEL CORP |
37.13 |
3.67% |
15.27% |
0.63% |
7.51% |
14.34 |
Computer and Technology |
CSCO |
TRV |
TRAVELERS COS |
115.35 |
5.86% |
11.21% |
0.58% |
6.93% |
11.88 |
Finance |
INTC |
JNJ |
JOHNSON & JOHNS |
117.97 |
4.28% |
22.90% |
0.56% |
6.75% |
18.15 |
Medical |
TRV |
MRK |
MERCK & CO INC |
61.66 |
13.58% |
21.59% |
0.51% |
6.14% |
16.53 |
Medical |
JNJ |
JPM |
JPMORGAN CHASE |
68.13 |
10.77% |
10.39% |
0.48% |
5.74% |
12.08 |
Finance |
UTX |
CSCO |
CISCO SYSTEMS |
30.34 |
2.03% |
8.51% |
0.42% |
5.00% |
14.11 |
Computer and Technology |
UNH |
UNH |
UNITEDHEALTH GP |
135.1 |
-3.47% |
10.28% |
0.32% |
3.80% |
18.63 |
Medical |
IBM |
DD |
DU PONT (EI) DE |
68.78 |
15.83% |
23.57% |
0.28% |
3.41% |
23.08 |
Basic Materials |
DD |
IBM |
INTL BUS MACH |
154.29 |
-1.03% |
2.08% |
0.28% |
3.36% |
11.56 |
Computer and Technology |
MRK |
NOTE: New stocks are in BOLD, old stocks that have moved up the list are in GREEN, old stocks that have declined in position are in RED, and stocks which have retained their position are in CAPS.
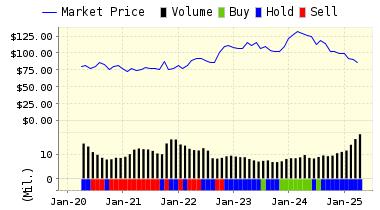
Below is today's data on Merck (MRK):
Merck & Co., Inc. is a global research-driven pharmaceutical company dedicated to putting patients first. Established in 1891, Merck discovers, develops, manufactures and markets vaccines and medicines to address unmet medical needs. The company devotes extensive efforts to increase access to medicines through far-reaching programs that not only donate Merck medicines but help deliver them to the people who need them. Merck also publishes unbiased health information as a not-for-profit service.
VALUENGINE RECOMMENDATION: ValuEngine continues its BUY recommendation on MERCK & CO INC for 2016-10-12. Based on the information we have gathered and our resulting research, we feel that MERCK & CO INC has the probability to OUTPERFORM average market performance for the next year. The company exhibits ATTRACTIVE Company Size and Sharpe Ratio.
You can download a free copy of detailed report on Merck (MRK) from the link below.
ValuEngine Forecast |
| |
Target
Price* |
Expected
Return |
1-Month |
61.98 |
0.51% |
3-Month |
63.46 |
2.92% |
6-Month |
65.45 |
6.14% |
1-Year |
65.44 |
6.14% |
2-Year |
72.80 |
18.07% |
3-Year |
78.28 |
26.95% |
Valuation & Rankings |
Valuation |
13.58% overvalued |
|
 22 22 |
1-M Forecast Return |
0.51% |
1-M Forecast Return Rank |
85 |
12-M Return |
21.59% |
|
78 |
Sharpe Ratio |
0.83 |
|
89 |
5-Y Avg Annual Return |
12.93% |
5-Y Avg Annual Rtn Rank |
77 |
Volatility |
15.66% |
|
82 |
Expected EPS Growth |
3.49% |
|
27 |
Market Cap (billions) |
175.79 |
Size Rank |
100 |
Trailing P/E Ratio |
16.53 |
|
71 |
Forward P/E Ratio |
15.97 |
Forward P/E Ratio Rank |
49 |
PEG Ratio |
4.74 |
PEG Ratio Rank |
8 |
Price/Sales |
4.46 |
|
22 |
Market/Book |
33.03 |
|
5 |
Beta |
0.70 |
Beta Rank |
58 |
Alpha |
0.15 |
Alpha Rank |
78 |

DOWNLOAD A FREE SAMPLE OF OUR REPORT ON MERCK (MRK) BY CLICKING HERE
ValuEngine Market Overview
Summary of VE Stock Universe |
Stocks Undervalued |
52.89% |
Stocks Overvalued |
47.11% |
Stocks Undervalued by 20% |
20.96% |
Stocks Overvalued by 20% |
15.38% |
ValuEngine Sector Overview
|
|
|
|
|
|
|
|
0.19% |
-2.15% |
16.30% |
5.58% overvalued |
13.31% |
23.26 |
|
-0.34% |
-1.87% |
16.21% |
4.11% overvalued |
7.05% |
29.84 |
|
0.09% |
2.32% |
21.39% |
3.86% overvalued |
-3.54% |
26.34 |
|
0.06% |
-2.04% |
9.04% |
3.63% overvalued |
11.68% |
21.70 |
|
0.20% |
-0.81% |
6.86% |
2.17% overvalued |
0.90% |
20.82 |
|
0.41% |
-1.47% |
9.22% |
1.92% overvalued |
8.80% |
23.95 |
|
0.31% |
-0.86% |
6.38% |
0.22% overvalued |
3.39% |
16.56 |
|
0.16% |
-2.69% |
41.29% |
0.27% undervalued |
51.30% |
28.66 |
|
-0.28% |
-1.07% |
1.62% |
0.62% undervalued |
5.73% |
17.84 |
|
0.31% |
-1.62% |
12.93% |
1.28% undervalued |
0.47% |
24.39 |
|
-0.46% |
-0.25% |
10.96% |
2.96% undervalued |
-15.07% |
16.66 |
|
-0.04% |
-1.30% |
8.23% |
3.38% undervalued |
-0.12% |
22.93 |
|
0.18% |
-1.27% |
29.77% |
4.88% undervalued |
13.80% |
19.79 |
|
0.05% |
-0.33% |
7.38% |
5.00% undervalued |
4.33% |
15.16 |
|
0.05% |
-0.47% |
0.15% |
5.25% undervalued |
0.02% |
22.07 |
|
-0.84% |
-1.51% |
1.32% |
5.83% undervalued |
-7.23% |
25.55 |
ValuEngine.com is an independent research provider, producing buy/hold/sell recommendations, target price, and valuations on over 7,000 US and Canadian equities every trading day.
Visit www.ValuEngine.com for more information

|


