November 17, 2016
VALUATION WATCH: Overvalued stocks now make up 59.46% of our stocks assigned a valuation and 26.86% of those equities are calculated to be overvalued by 20% or more. Fourteen sectors are calculated to be overvalued.
If you cannot display this bulletin properly, GO HERE
Indexing
--ValuEngine: Verizon Falls From DOW Top Spot
ValuEngine tracks more than 7000 US equities, ADRs, and foreign stock which trade on US exchanges as well as @1000 Canadian equities. When EPS estimates are available for a given equity, our model calculates a level of mispricing or valuation percentage for that equity based on earnings estimates and what the stock should be worth if the market were totally rational and efficient--an academic exercise to be sure, but one which allows for useful comparisons between equities, sectors, and industries. Using our Valuation Model, we can currently assign a VE valuation calculation to more than 2800 stocks in our US Universe.
We also use trading data to provide forecast estimates for a variety of time horizons for almost ever equity in our database. Our Buy/Sell/Hold recommendations are based upon the 1-year forecast return figure. Using valuation and forecast figures, you can rank and rate our covered stocks against each other, to find out, in an objective and systematic way, the most attractive investment targets based on your own risk/reward parameters. We re-calculate the entire database every trading day, so you are assured that every proprietary valuation and forecast datapoint is as up-to-date as possible.
We can use our data to track individual stocks, industries, sectors, and indices. For today's bulletin, we present key metrics for the top picks in the Dow Jones Industrials. The companies listed below represent the top stocks within the index. They are presented below according to their one-month forecast gain.
When we look at our DOW top-ten list lately, two things are true; we typically see very little turnover, and Verizon is number one. This month we see some slight variation to this rule as Verizon has been dethroned as the top DOW stock by IBM. Since we last presented the top Dow picks on October 13th, we also have two newcomers--Wal-Mart and Caterpillar. Those newcomers replaced Dupont and Traveler's Insurance.
Within the remaining eight unchanged components, Cisco, United Health, and JPMorgan Chase climbed up along with IBM. Johnson and Johnason, Intel, and Merck declined along with Verizon.
Also, be advised that once again we have no STRONG BUY-rated stocks in the DOW right now. Intel, Merck, and Caterpillar are NOT ranked BUY, they are all currently rated as HOLDs by our models. The top-seven other DOW companies are BUY-rated stocks.
Ticker |
Company Name |
Market Price |
Valuation |
Last 12-M Retrn |
1-M Forecast Retn |
1-Yr Forecast Retn |
P/E Ratio |
Sector Name |
Sept. 8th, 2016 |
IBM |
INTL BUS MACH |
159.29 |
7.60% |
19.13% |
0.86% |
10.33% |
11.84 |
Computer and Technology |
VZ |
WMT |
WAL-MART STORES |
71.39 |
9.58% |
23.36% |
0.72% |
8.66% |
15.86 |
Retail-Wholesale |
INTC |
CSCO |
CISCO SYSTEMS |
31.57 |
9.03% |
17.84% |
0.65% |
7.76% |
14.68 |
Computer and Technology |
TRV |
UNH |
UNITEDHEALTH GP |
151.5 |
17.44% |
33.10% |
0.56% |
6.66% |
20.03 |
Medical |
JNJ |
JPM |
JPMORGAN CHASE |
77.4 |
26.05% |
16.37% |
0.54% |
6.49% |
13.24 |
Finance |
MRK |
VZ |
VERIZON COMM |
47.93 |
-6.41% |
6.42% |
0.53% |
6.31% |
12.28 |
Utilities |
JPM |
JNJ |
JOHNSON & JOHNS |
116.36 |
0.55% |
14.96% |
0.47% |
5.65% |
17.68 |
Medical |
CSCO |
INTC |
INTEL CORP |
34.84 |
3.46% |
8.54% |
0.46% |
5.48% |
13.03 |
Computer and Technology |
UNH |
MRK |
MERCK & CO INC |
62.63 |
20.69% |
16.63% |
0.40% |
4.77% |
16.44 |
Medical |
DD |
CAT |
CATERPILLAR INC |
93.35 |
20.55% |
32.62% |
0.31% |
3.75% |
28.09 |
Industrial Products |
IBM |
NOTE: New stocks are in BOLD, old stocks that have moved up the list are in GREEN, old stocks that have declined in position are in RED, and stocks which have retained their position are in CAPS.
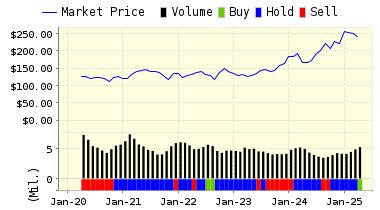
Below is today's data on IBM (IBM):
IBM is an information technology (IT) company. The company operates in five segments: Global Technology Services, Global Business Services, Software, Systems and Technology, and Global Financing. The Global Technology Services segment provides IT infrastructure services and business process services. The Global Business Services segment offers professional services and application management services. The Software segment consists primarily of middleware and operating systems software. The Systems and Technology segment provides computing power and storage solutions; and semiconductor technology products and packaging solutions. The Global Financing segment invests in financing assets, leverages with debt and manages the associated risks. IBM is headquartered in Armonk, New York.
VALUENGINE RECOMMENDATION: ValuEngine continues its BUY recommendation on INTL BUS MACH for 2016-11-16. Based on the information we have gathered and our resulting research, we feel that INTL BUS MACH has the probability to OUTPERFORM average market performance for the next year. The company exhibits ATTRACTIVE Company Size and P/E Ratio.
You can download a free copy of detailed report on IBM (IBM) from the link below.
ValuEngine Forecast |
| |
Target
Price* |
Expected
Return |
1-Month |
160.66 |
0.86% |
3-Month |
163.26 |
2.49% |
6-Month |
165.62 |
3.97% |
1-Year |
175.75 |
10.33% |
2-Year |
173.78 |
9.09% |
3-Year |
171.76 |
7.83% |
Valuation & Rankings |
Valuation |
7.60% overvalued |
|
 47 47 |
1-M Forecast Return |
0.86% |
1-M Forecast Return Rank |
96 |
12-M Return |
19.13% |
|
73 |
Sharpe Ratio |
-0.21 |
|
35 |
5-Y Avg Annual Return |
-3.67% |
5-Y Avg Annual Rtn Rank |
41 |
Volatility |
17.20% |
|
77 |
Expected EPS Growth |
3.00% |
|
28 |
Market Cap (billions) |
157.86 |
Size Rank |
100 |
Trailing P/E Ratio |
11.84 |
|
87 |
Forward P/E Ratio |
11.49 |
Forward P/E Ratio Rank |
76 |
PEG Ratio |
3.95 |
PEG Ratio Rank |
11 |
Price/Sales |
1.97 |
|
47 |
Market/Book |
9.20 |
|
14 |
Beta |
0.95 |
Beta Rank |
46 |
Alpha |
0.07 |
Alpha Rank |
68 |

DOWNLOAD A FREE SAMPLE OF OUR REPORT ON IBM (IBM) BY CLICKING HERE
ValuEngine Market Overview
Summary of VE Stock Universe |
Stocks Undervalued |
40.54% |
Stocks Overvalued |
59.46% |
Stocks Undervalued by 20% |
17.37% |
Stocks Overvalued by 20% |
26.86% |
ValuEngine Sector Overview
|
|
|
|
|
|
|
|
-0.20% |
2.41% |
8.69% |
20.07% overvalued |
3.42% |
19.06 |
|
-0.22% |
5.81% |
21.48% |
18.72% overvalued |
14.69% |
23.63 |
|
-0.24% |
5.50% |
10.05% |
14.31% overvalued |
10.06% |
19.03 |
|
0.36% |
8.57% |
15.84% |
11.70% overvalued |
0.87% |
18.51 |
|
-0.24% |
1.23% |
32.93% |
10.12% overvalued |
0.93% |
26.16 |
|
-0.37% |
5.36% |
30.44% |
9.95% overvalued |
14.64% |
20.74 |
|
0.39% |
3.48% |
19.24% |
9.67% overvalued |
8.47% |
29.59 |
|
-0.06% |
4.89% |
11.22% |
8.77% overvalued |
6.94% |
16.63 |
|
-0.84% |
3.15% |
49.83% |
7.12% overvalued |
58.92% |
27.95 |
|
0.47% |
4.36% |
16.81% |
6.84% overvalued |
-0.49% |
24.20 |
|
-0.06% |
3.31% |
8.86% |
5.01% overvalued |
7.64% |
23.68 |
|
0.58% |
4.39% |
1.52% |
4.04% overvalued |
5.73% |
22.91 |
|
0.33% |
-0.34% |
10.80% |
3.13% overvalued |
9.69% |
21.28 |
|
0.18% |
-0.50% |
8.96% |
2.14% overvalued |
9.18% |
24.00 |
|
-0.76% |
2.98% |
0.24% |
1.09% undervalued |
-9.97% |
26.01 |
|
-0.13% |
2.67% |
7.91% |
1.14% undervalued |
13.09% |
14.23 |
ValuEngine.com is an independent research provider, producing buy/hold/sell recommendations, target price, and valuations on over 7,000 US and Canadian equities every trading day.
Visit www.ValuEngine.com for more information

|


