December 8, 2016
VALUATION WARNING: Overvalued stocks now make up 65.18% of our stocks assigned a valuation and 32.91% of those equities are calculated to be overvalued by 20% or more. Fifteen sectors are calculated to be overvalued.
If you cannot display this bulletin properly, GO HERE
NASDAQ TURNOVER
--ValuEngine: Applied Materials Remains Dominant on Latest NASDAQ 100 Top- Stock List
ValuEngine tracks more than 7000 US equities, ADRs, and foreign stock which trade on US exchanges as well as @1000 Canadian equities. When EPS estimates are available for a given equity, our model calculates a level of mispricing or valuation percentage for that equity based on earnings estimates and what the stock should be worth if the market were totally rational and efficient--an academic exercise to be sure, but one which allows for useful comparisons between equities, sectors, and industries. Using our Valuation Model, we can currently assign a VE valuation calculation to more than 2800 stocks in our US Universe.
We also use trading data to provide forecast estimates for a variety of time horizons for almost ever equity in our database. Our Buy/Sell/Hold recommendations are based upon the 1-year forecast return figure. Using valuation and forecast figures, you can rank and rate our covered stocks against each other, to find out, in an objective and systematic way, the most attractive investment targets based on your own risk/reward parameters. We re-calculate the entire database every trading day, so you are assured that every proprietary valuation and forecast datapoint is as up-to-date as possible.
We can use our data to track individual stocks, industries, sectors, and indices. For today's bulletin, we present key metrics for the top picks in the NASDAQ 100. The companies listed below represent the top-ten BUY and STRONG BUY stocks within the index. They are presented below according to their one-month forecast target prices.
Since we last reported on the NASDAQ back in November, we find a 40% turnover. However, three of the top four companies have held onto their positions. Applied Materials has retained its lead yet again, with LAM Research and Netease keeping their second and fourth spots respectively.
CA Inc, Cisco Systems, and Broadcom have declined to make room for newcomers Qualcomm, Paccar, Seagate Technology, and American Airlines.
Dollar Tree, Nvidia, NXP Semiconductor, and ULTA Cosmetics have fallen out of our top-ten this month.
Note too, all of these companies are BUY-rated with the exception of leader Applied Materials. That company remains a STRNG BUY.
Ticker |
Company Name |
Market Price |
Valuation |
Last 12-M Retrn |
1-M Forecast Retn |
1-Yr Forecast Retn |
P/E Ratio |
Sector |
11-3-2016 Leaders |
AMAT |
APPLD MATLS INC |
32.51 |
5.48% |
71.92% |
1.04% |
12.52% |
17.17 |
Computer and Technology |
AMAT |
LRCX |
LAM RESEARCH |
106.55 |
7.00% |
36.80% |
0.92% |
11.04% |
15.73 |
Computer and Technology |
LRCX |
QCOM |
QUALCOMM INC |
68.34 |
7.22% |
30.35% |
0.78% |
9.32% |
16.80 |
Computer and Technology |
AVGO |
NTES |
NETEASE INC |
223.16 |
-0.22% |
25.41% |
0.70% |
8.44% |
17.72 |
Computer and Technology |
NTES |
PCAR |
PACCAR INC |
67.63 |
36.99% |
37.96% |
0.68% |
8.10% |
17.18 |
Auto-Tires-Trucks |
CA |
STX |
SEAGATE TECH |
40.27 |
10.71% |
14.73% |
0.64% |
7.72% |
14.02 |
Computer and Technology |
CSCO |
AAL |
AMER AIRLINES |
48.65 |
26.70% |
6.27% |
0.63% |
7.58% |
7.02 |
Transportation |
DLTR |
CA |
CA INC |
31.75 |
12.51% |
11.64% |
0.57% |
6.87% |
13.47 |
Computer and Technology |
NVDA |
CSCO |
CISCO SYSTEMS |
29.95 |
2.95% |
8.95% |
0.52% |
6.26% |
13.93 |
Computer and Technology |
NXPI |
AVGO |
BROADCOM LTD |
168.55 |
-0.53% |
13.25% |
0.49% |
5.85% |
17.09 |
Computer and Technology |
ULTA |
NOTE: New stocks are in BOLD, old stocks that have moved up the list are in GREEN, old stocks that have declined in position are in RED, and stocks which have retained their position are in CAPS.
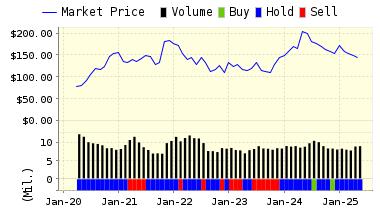
Below is today's data on Qualcomm (QCOM):
QUALCOMM Inc. develops and delivers innovative digital wireless communications products and services based on the company's CDMA digital technology. The company's business areas include CDMA integrated circuits and system software; technology licensing; the Binary Runtime Environment for Wireless applications development platform; Eudora e-mail software; digital cinema systems; and satellite-based systems including portions of the Globalstar system and wireless fleet management systems, OmniTRACS and OmniExpress.
VALUENGINE RECOMMENDATION: ValuEngine continues its BUY recommendation on Qualcomm for 2016-12-07. Based on the information we have gathered and our resulting research, we feel that Qualcomm has the probability to OUTPERFORM average market performance for the next year. The company exhibits ATTRACTIVE Company Size and Momentum.
You can download a free copy of detailed report on Qualcomm (QCOM) from the link below.
ValuEngine Forecast |
| |
Target
Price* |
Expected
Return |
1-Month |
68.87 |
0.78% |
3-Month |
69.26 |
1.35% |
6-Month |
70.02 |
2.46% |
1-Year |
74.71 |
9.32% |
2-Year |
69.70 |
1.99% |
3-Year |
72.53 |
6.13% |
Valuation & Rankings |
Valuation |
7.22% overvalued |
|
 54 54 |
1-M Forecast Return |
0.78% |
1-M Forecast Return Rank |
94 |
12-M Return |
30.35% |
|
76 |
Sharpe Ratio |
0.18 |
|
64 |
5-Y Avg Annual Return |
4.35% |
5-Y Avg Annual Rtn Rank |
62 |
Volatility |
24.20% |
|
64 |
Expected EPS Growth |
-0.08% |
|
21 |
Market Cap (billions) |
112.89 |
Size Rank |
100 |
Trailing P/E Ratio |
16.80 |
|
74 |
Forward P/E Ratio |
16.82 |
Forward P/E Ratio Rank |
51 |
PEG Ratio |
n/a |
PEG Ratio Rank |
n/a |
Price/Sales |
4.79 |
|
22 |
Market/Book |
5.00 |
|
25 |
Beta |
1.40 |
Beta Rank |
23 |
Alpha |
0.26 |
Alpha Rank |
84 |

DOWNLOAD A FREE SAMPLE OF OUR DOLLAR TREE (DLTR) REPORT BY CLICKING HERE
ValuEngine Market Overview
Summary of VE Stock Universe |
Stocks Undervalued |
34.82% |
Stocks Overvalued |
65.18% |
Stocks Undervalued by 20% |
15.9% |
Stocks Overvalued by 20% |
32.91% |
ValuEngine Sector Overview
|
|
|
|
|
|
|
|
0.87% |
2.84% |
28.12% |
25.57% overvalued |
21.82% |
24.01 |
|
1.09% |
3.22% |
14.07% |
21.01% overvalued |
9.75% |
19.45 |
|
0.58% |
1.48% |
14.80% |
19.33% overvalued |
12.40% |
20.44 |
|
1.09% |
3.73% |
60.40% |
16.77% overvalued |
65.60% |
27.85 |
|
0.04% |
2.73% |
31.03% |
16.56% overvalued |
22.19% |
25.30 |
|
1.50% |
3.30% |
38.58% |
15.39% overvalued |
19.64% |
20.77 |
|
0.78% |
2.51% |
16.31% |
14.87% overvalued |
10.75% |
18.15 |
|
1.18% |
3.16% |
21.43% |
14.35% overvalued |
8.30% |
18.77 |
|
0.98% |
1.96% |
20.49% |
11.18% overvalued |
5.28% |
23.87 |
|
0.43% |
1.12% |
21.40% |
10.86% overvalued |
9.53% |
29.98 |
|
0.92% |
2.16% |
4.74% |
9.38% overvalued |
5.57% |
23.92 |
|
1.90% |
3.70% |
14.69% |
9.25% overvalued |
19.79% |
15.01 |
|
0.97% |
1.79% |
12.10% |
8.37% overvalued |
10.65% |
23.75 |
|
1.09% |
1.67% |
15.00% |
6.70% overvalued |
17.06% |
22.14 |
|
0.68% |
1.15% |
8.65% |
3.06% overvalued |
5.49% |
24.14 |
|
-0.49% |
-0.13% |
-1.28% |
5.49% undervalued |
-8.42% |
27.37 |
ValuEngine.com is an independent research provider, producing buy/hold/sell recommendations, target price, and valuations on over 7,000 US and Canadian equities every trading day.
Visit www.ValuEngine.com for more information

|


