

February 20, 2015
Valuation Watch: Overvalued stocks now make up 60.15% of our stocks assigned a valuation and 20.93% of those equities are calculated to be overvalued by 20% or more. Twelve sectors are calculated to be overvalued--with six at or near double digits. ValuEngine Index Overview
ValuEngine Market Overview
ValuEngine Sector Overview
ValuEngine Newsletters Latest Results
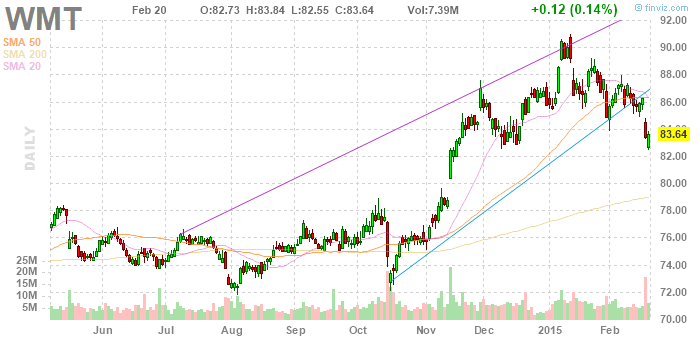
*NOTE: Benchmark for Forecast MNS for last month and inception is the MLSAX Long/Short Fund. Benchmark for Small Cap is the Russell 2000 Small Cap Index (RUT). Benchmark for current month Forecast MNS and VE View and VE Dividend for all timeframes is the S&P500. ValuEngine's Newsletters Beat the Market Let ValuEngine Optimize your Portfolio and Provide Rational Advice for Smarter Investing Click HERE to Check Out ValuEngine's Investment Newsletters Free Download for ReadersAs a bonus to our Free Weekly Newsletter subscribers, Wal-Mart Stores, Inc.(WMT) is the world's largest retailer. They are engaged in the operation of mass merchandising stores, which serve their customers primarily through the operation of three segments, which are the Wal-Mart Stores segment, the SAM'S Club segment and the International segment. The company made news this week by announcing plans to raise wages for full-time workers to a minimum of $10/hour by February, 2016. According to the company, with the increases to starting pay and across-the-board raises, average hourly wages for full-time employees will increase to @$13/hour. CEO Doug McMillon noted that the company's reputation for poor labor practices had hurt WalMart and claimed that "we’re strengthening investments in our people to engage and inspire them to deliver superior customer experiences.”
VALUENGINE RECOMMENDATION: ValuEngine continues its HOLD recommendation on WAL-MART STORES for 2015-02-19. Based on the information we have gathered and our resulting research, we feel that WAL-MART STORES has the probability to ROUGHLY MATCH average market performance for the next year. The company exhibits ATTRACTIVE Company Size but UNATTRACTIVE Earnings Growth Rate. Below is today's data on WMT: 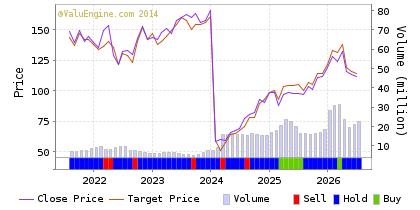
As a bonus to our Newsletter readers, Read our Complete Detailed Valuation Report on WalMart HERE.
|
||||||||||||||||||||||||||||||||||||||||||||||||||||||||||||||||||||||||||||||||||||||||||||||||||||||||||||||||||||||||||||||||||||||||||||||||||||||||||||||||||||||||||||||||||||||||||||||||||||||||||||||||||||||||||||||||||||||||||||||||||||||||||||||||||||||||||||||||||||||||||||||||||||||||||||||||||||||||||||||||||||||||||||||||||||||||||||||||||||||||||||||||||||||||||||||||||||||||||||||||||||||||||||||||||||||||||||||||||||||||||||||||||||||||||||||||||||||||||||||||||||||||||||||||||||||||||||||||||||||||||||||||||||||||||||||||||||||||||||||||||||||||||||||||||||||||||||||||||||||||||||||||||||||||||||||||||||||||||||||||||||||||||||||||||||||||||||||||||||||||||||||||||||||||||||||||||||||||||||||||||||||||||



 31
31Ticker |
Name |
Mkt Price |
Valuation(%) |
Last 12-M Retn(%) |
| GPI | GROUP 1 AUTO |
83.47 |
-5.01 |
31.7 |
| FLWS | 1800FLOWERS.COM |
10.36 |
6.19 |
101.17 |
| GME | GAMESTOP CORP |
37.53 |
-9.82 |
5.42 |
| FL | FOOT LOCKER INC |
55.08 |
4.47 |
39.8 |
| IMKTA | INGLES MARKET A |
43.87 |
N/A |
88.77 |
Top-Five Retail/Wholesale Stocks--Long-Term Forecast Returns
Ticker |
Name |
Mkt Price |
Valuation(%) |
Last 12-M Retn(%) |
| GPI | GROUP 1 AUTO |
83.47 |
-5.01 |
31.7 |
| FLWS | 1800FLOWERS.COM |
10.36 |
6.19 |
101.17 |
| GME | GAMESTOP CORP |
37.53 |
-9.82 |
5.42 |
| FL | FOOT LOCKER INC |
55.08 |
4.47 |
39.8 |
| IMKTA | INGLES MARKET A |
43.87 |
N/A |
88.77 |
Top-Five Retail/Wholesale Stocks--Composite Score
Ticker |
Name |
Mkt Price |
Valuation(%) |
Last 12-M Retn(%) |
| GPI | GROUP 1 AUTO |
83.47 |
-5.01 |
31.7 |
| GME | GAMESTOP CORP |
37.53 |
-9.82 |
5.42 |
| FL | FOOT LOCKER INC |
55.08 |
4.47 |
39.8 |
| M | MACYS INC |
63 |
3.97 |
18.11 |
| PETM | PETSMART INC |
82.88 |
-1.05 |
28.96 |
Top-Five Retail/Wholesale Stocks--Most Overvalued
Ticker |
Name |
Mkt Price |
Valuation(%) |
Last 12-M Retn(%) |
| NFLX | NETFLIX INC |
474.6 |
152.16 |
10.83 |
| DENN | DENNY'S CORP |
11.43 |
93.92 |
77.76 |
| HGG | HHGREGG INC |
6.71 |
88.88 |
-30.47 |
| PTRY | PANTRY INC |
36.66 |
68.19 |
165.08 |
| OWW | ORBITZ WORLDWID |
11.54 |
66.36 |
30.99 |
Find out what Wall Street Investment and Media Professionals already know,
ValuEngine offers sophisticated stock valuation and forecast research as well as a variety of portfolio screening and creation tools.
If you are reading this you should sign up for ValuEngine's award-winning stock valuation and forecast service
NO OBLIGATION, 30 DAY FREE TRIAL!To Sign Up for a FREE TRIAL, Please Click HERE
What's Hot--
VE Forecast Market Neutral Newsletter
Our portfolio posted another excellent gain this month. Our 50/50 allocation's pick up of 10.15% beat the benchmark MLSAX's* gain of 1.09% by 906 bps. The modified stop-lossed strategy with a suggested 60-40 allocation gained even more with a pick up of 12.74%. The trailing 12 month percentage return is 3.62% for the newsletter and 11.07% for the MLSAX Long-Short Fund. Since inception, our portfolio has returned 105.43% vs the MLSAX return of 123.8%.
Find Out More About the VE Forecast 16 MNS HERE
Longs were once again stunning this month with thirteen winners for the second month in a row. Nine of our stocks were well above or near double-digit returns. Valentine's Day was good to us as 1800Flowers.com returned a whopping 39% and led our long side. Our shorts featured seven winners with Leapfrog's gain of 34% helping to preserve our portfolio's big pick up overall.
We have had a switch to an overvalued condition this month thanks to the market's latest rally. 60.15% of the stocks we can assign a valuation are calculated to be overvalued-- with 20.93% of them calculated to be overvalued by 20% or more. We remain bullish on US equities and find that the better job market—Wal-Mart just announced a minimum pay rate of $10/hour in response to employee action and wage pressures—is further evidence (finally) of a full-force US recovery. Unrest elsewhere has led to a stronger dollar and the new found US dominance in certain forms of energy is a great help as well.
Here are the primary long and short-side selections and their performance for the month.
Position |
Ticker |
Company Name |
Entry Price 12/18/14 |
Exit Price |
Change |
%Change |
Sector |
|
Long 1 |
OA |
ORBITAL ATK |
58.53 |
66.38 |
7.85 |
13.41 |
AEROSPACE |
|
Long 1 |
MGA |
MAGNA INTL CL A |
94.04 |
103.95 |
9.91 |
10.54 |
AUTO TIRES TRUCKS |
|
Long 1 |
SBGL |
SIBANYE GLD-ADR |
11.00 |
10.14 |
-0.86 |
-7.82 |
BASIC MATERIALS |
|
Long 1 |
BBSI |
BARRETT BUS SVS |
32.10 |
39.79 |
7.69 |
23.96 |
BUSINESS SERVICES |
|
Long 1 |
MU |
MICRON TECH |
29.67 |
31.81 |
2.14 |
7.21 |
COMPUTERS TECHNOLOGY |
|
Long 1 |
LEN |
LENNAR CORP -A |
42.29 |
50.24 |
7.95 |
18.80 |
CONSTRUCTION |
|
Long 1 |
STRZA |
STARZ-LIB CAP-A |
28.60 |
31.40 |
2.80 |
9.79 |
CONSUMER DISCRETIONARY |
|
Long 1 |
TSN |
TYSON FOODS A |
40.31 |
41.34 |
1.03 |
2.56 |
CONSUMER STAPLES |
|
Long 1 |
CYS |
CYS INVESTMENTS |
8.89 |
8.81 |
-0.08 |
-0.90 |
FINANCE |
|
Long 1 |
UEPS |
NET 1 UEPS TECH |
11.97 |
13.46 |
1.49 |
12.45 |
INDUSTRIAL PRODUCTS |
|
Long 1 |
LCI |
LANNETT INC |
46.37 |
63.28 |
16.91 |
36.47 |
MEDICAL |
|
Long 1 |
LDL |
LYDALL INC |
29.37 |
30.88 |
1.51 |
5.14 |
MULTI-SECTOR CONGLOM |
|
Long 1 |
EMES |
EMERGE ENRG SVC |
57.70 |
55.57 |
-2.13 |
-3.69 |
OILS ENERGY |
|
Long 1 |
FLWS |
1800FLOWERS.COM |
7.44 |
10.36 |
2.92 |
39.25 |
RETAIL WHOLESALE |
|
Long 1 |
GBX |
GREENBRIER COS |
49.97 |
57.34 |
7.37 |
14.75 |
TRANSPORTATION |
|
Long 1 |
BIP |
BROOKFIELD INFR |
42.07 |
44.46 |
2.39 |
5.68 |
UTILITIES |
|
Short 1 |
AVAV |
AEROVIRONMENT |
25.46 |
27.93 |
-2.47 |
-9.70 |
AEROSPACE |
|
Short 1 |
NAV |
NAVISTAR INTL |
31.77 |
29.16 |
2.61 |
8.22 |
AUTO TIRES TRUCKS |
|
Short 1 |
SCHN |
SCHNITZER STEEL |
16.75 |
16.24 |
0.51 |
3.04 |
BASIC MATERIALS |
|
Short 1 |
MRIN |
MARIN SOFTWARE |
7.06 |
6.72 |
0.34 |
4.82 |
BUSINESS SERVICES |
|
Short 1 |
RST |
ROSETTA STONE |
9.17 |
9.69 |
-0.52 |
-5.67 |
COMPUTERS TECHNOLOGY |
|
Short 1 |
LPX |
LOUISIANA PAC |
15.74 |
17.27 |
-1.53 |
-9.72 |
CONSTRUCTION |
|
Short 1 |
LF |
LEAPFROG ENTRPS |
3.95 |
2.58 |
1.37 |
34.68 |
CONSUMER DISCRETIONARY |
|
Short 1 |
RDEN |
ELIZABETH ARDEN |
17.72 |
16.68 |
1.04 |
5.87 |
CONSUMER STAPLES |
|
Short 1 |
FBC |
FLAGSTAR BANCP |
16.15 |
14.77 |
1.38 |
8.54 |
FINANCE |
|
Short 1 |
MYE |
MYERS INDS |
16.47 |
17.94 |
-1.47 |
-8.93 |
INDUSTRIAL PRODUCTS |
|
Short 1 |
INSM |
INSMED INC |
14.84 |
17.61 |
-2.77 |
-18.67 |
MEDICAL |
|
Short 1 |
CODI |
COMPASS DIVERSF |
16.32 |
16.48 |
-0.16 |
-0.98 |
MULTI-SECTOR CONGLOM |
|
Short 1 |
POWR |
POWERSECURE INT |
10.25 |
9.92 |
0.33 |
3.22 |
OILS ENERGY |
|
Short 1 |
HGG |
HHGREGG INC |
5.29 |
6.71 |
-1.42 |
-26.84 |
RETAIL WHOLESALE |
|
Short 1 |
UTIW |
UTI WORLDWIDE |
11.36 |
12.50 |
-1.14 |
-10.04 |
TRANSPORTATION |
|
Short 1 |
PEGI |
PATTERN ENERGY |
27.63 |
28.45 |
-0.82 |
-2.97 |
UTILITIES |
|
PORTFOLIO TOTAL |
|
|||||||
GSPC |
S&P500 |
1685.39 |
1687.99 |
2.60 |
3.70 | |||
LONG PORTFOLIO |
|
|||||||
SHORT PORTFOLIO |
|
Find Out More About the VE Forecast 16 MNS HERE
AAII Selects ValuEngine.com "Best of the Web"
The American Association of Individual Investors (AAII) was founded in 1978 by Dr. James Cloonan. Its purpose is to distill current financial theory and academic knowledge in a manner which allows its members to beat the market. In short, AAII's philosophy and membership base is a perfect match for ValuEngine's various newsletters, website services, and other products.
ValuEngine clients access proprietary stock valuation data on more than 4000 US equities in addition to forecast and ratings for more than 8000 stocks. They can also purchase ready-made portfolios based on all of our data which are designed to fit a variety of investment styles and risk/reward profiles.
ValuEngine is always searching for self-directed investors who recognize the value of our services--just like the members of AAII, and for that reason we are proud to announce that we were recently selected one of AAII's "Best of the Web" services. AAII puts Valuengine.com within the "top 16 sites for consensus analyst estimates, ratings and recommendations, stock screening, and stock valuation.
It is important to note that in an era of free content, apps, and services, ValuEngine has almost always been the only fee-based service to win a stock valuation award from AAII. We have won this award numerous times and AAII notes that
ValuEngine provides a wide range of services for individual investors and is an excellent source for stock valuation. It was chosen as Editor’s Choice because of its in-depth analysis and innovative valuation techniques that are not available at other sites.
ValuEngine CEO Paul Henneman has always been a strong supporter of AAII's program and services for individual investors and noted that "ValuEngine's objective, cutting-edge research provides the tools for any investor looking to reduce management fees and handle their own portfolios. Savvy individuals, Wall St. professionals, and the leaders of AAII have known for years that ValuEngine.com offers an outstanding suite of products which an help improve returns and beat the market. So, we are of course pleased to be recognized by AAII for yet another year."
Want To Know More About Our ValuEngine View Newsletter?
Looking for a monthly portfolio of stock picks which are objective and based on cutting-edge academic theory and Wall St.practice? Then subscribe to The ValuEngine View Newsletter.The ValuEngine View Portfolio is based on our highly-refined and tested ValuEngine Portfolio Strategies along with our proprietary quant-based composite scoring system. The ValuEngine View Newsletter is the product of sophisticated stock valuation and forecast models first developed by Yale Professor of Finance Zhiwu Chen.
The ValuEngine View Newsletter is the product of a sophisticated stock valuation model that was first developed by ValuEngine's academic research team. It utilizes a three factor approach: fundamental variables such as a company's trailing 12-month Earnings-Per-Share (EPS), the analyst consensus estimate of the company's future 12-month EPS, and the 30-year Treasury yield are all used to create a more accurate reflection of a company's fair value. A total of eleven additional firm specific variables are also used. In addition, the portoflio uses top picks from our Forecast Model. In essence, the portfolio is constructed with the best picks from our main propiretary models
Each month you will receive an electronic copy of our newsletter highlighting 15 potential long positions along with five alternate picks. Our investment strategies focus on dozens of fundamental and technical factors for over 8000 individual stocks, synthesize the data, and then come up with a portfolio. Each newsletter portfolio focuses on maximum potential returns so there are no diversity requirements. Each portfolio pick includes critical ValuEngine valuation and forecast data. These 20 total picks represent the most up-to-date equity assessments of our proprietary models.
Please click HERE to subscribe. You may download a sample copy HERE. After your subscription is approved, you will immediately receive access to download the current issue of newsletter as well as the previous issues, which are all available as PDF files. Each month when the latest issue of the newsletter is released, we will send you an email, informing you to download it from the site. The newsletter is released near the middle of each month.
VE View vs. S&P 500 Index Past Five Years |
||
VE View |
S&P 500 |
|
|---|---|---|
Ann Return |
21.67% |
13.60% |
Ann Volatility |
22.28% |
12.38% |
Sharpe Ratio |
0.97 |
1.10 |
Sortino Ratio |
1.67 |
1.46 |
Max Drawdown |
-34.94% | -11.14% |
The ValuEngine View Newsletter is derived from the ValuEngine Aggressive and Diversified Growth Benchmark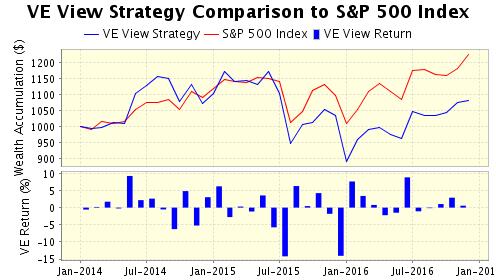 Portfolio Strategies. These strategies are the product of ValuEngine's academic research team and combine cutting-edge financial analysis and portfolio construction techniques with real-world Wall St. know how.
CLICK HERE to Subscribe to the ValuEngine View
The ValuEngine View Newsletter portfolio has 15 primary stock picks and five alternates and is re-balanced once each month. The ValuEngine View Newsletter is published near the middle of each calendar month. An equal amount of capital is allocated to each stock. The monthly returns are calculated from the closing prices on date of publication. The performance calculation does not include any transaction costs.
If you no longer wish to receive this free newsletter, CLICK HERE to unsubscribe

