|
ValuEngine employs many proprietary models based on the most innovative concepts in financial theory from academia
and Wall Street. ValuEngine's Stock Valuation, Stock Forecast, Portfolio Forecast, and Portfolio Builder models
utilize state-of-the-art valuation, forecasting, and advisory technologies:
*******************************************************************************
The ValuEngine Stock Valuation Model
The recent work of several Ivy League scholars provide the intellectual theory behind VE's Stock Valuation Model.
- Stock Valuation in Dynamic Economies, Bakshi, Chen, 2001.
- A Generalized Earnings-Based Stock Valuation Model, Dong, Hirshleifer, 2004.
- Stock Valuation and Investment Strategies, Chen, Dong, 2001.
- Investing With a Stock Valuation Model, Chang, Chen and Dong, 1999.
VE models are more sophisticated than traditional valuation models and outperform their peers. VE employs a three-factor approach to stock valuation using fundamental variables--the company's trailing 12-month Earnings-Per-Share (EPS), the analyst consensus estimate of the company's forecasted 12-month EPS, and the 30-year Treasury yield--to
create a highly accurate reflection of a company's fair value. Armed with these framework features, the ValuEngine Stock Valuation Model then calculates the ValuEngine proprietary "fair market valuation" for the stock.
Below are some of the variables that are utilized when calculating the VE Fair Market Valuation of a stock:
Firm-specific variables:
- Long-run EPS growth rate
- Duration of Business-growth-cycle
- Volatility of EPS growth rate
- Systematic or beta risk of the firm
- Correlation between the firm's EPS and the interest rate environment
- EPS growth volatility
- Dividend payout ratio
- Buffer earnings
Interest rate related criteria:
- Interest rate (30 year yield) long-run level
- Duration of interest rate cycle
- Interest rate volatility
The VE Fair Market Valuation uses 12-month historic and forecasted EPS values and the current
30-year treasury yield as primary determinants. When calculating risk/return values such as the Sharpe ratio,
the historic periods used are five years.
Some expected results of the VE Stock Evaluation Model's application are as follows:
- The Valuation of a stock increases in a declining interest rate environment.
- Increasing current and/or projected EPS will produce a higher Valuation.
- While long-term EPS growth would produce a corresponding long-term Valuation increase, concomitant long-term interest rate increases would offset EPS growth and depress the Valuation.
- The shorter a company's own business cycle, the higher its stock Valuation will be.
Reliability of the ValuEngine Model
Every ValuEngine model has been extensively back-tested in the United States equities markets. The investment performance of each model has been proven to exceed that of many well-known stock-picking styles.
For various summary portfolio performance of actual portfolios traded by ValuEngine Capital Management, LLC
using the ValuEngine quantitative models, please visit http://valuenginecapital.com/strategies/
Our Engine ratings are based on inputs from our models and allow for a simple comparison of stock quality. The highest rating is a "5-Engine" which is a considered a "strong buy" rating while the opposite is a "1-Engine" or "strong sell."
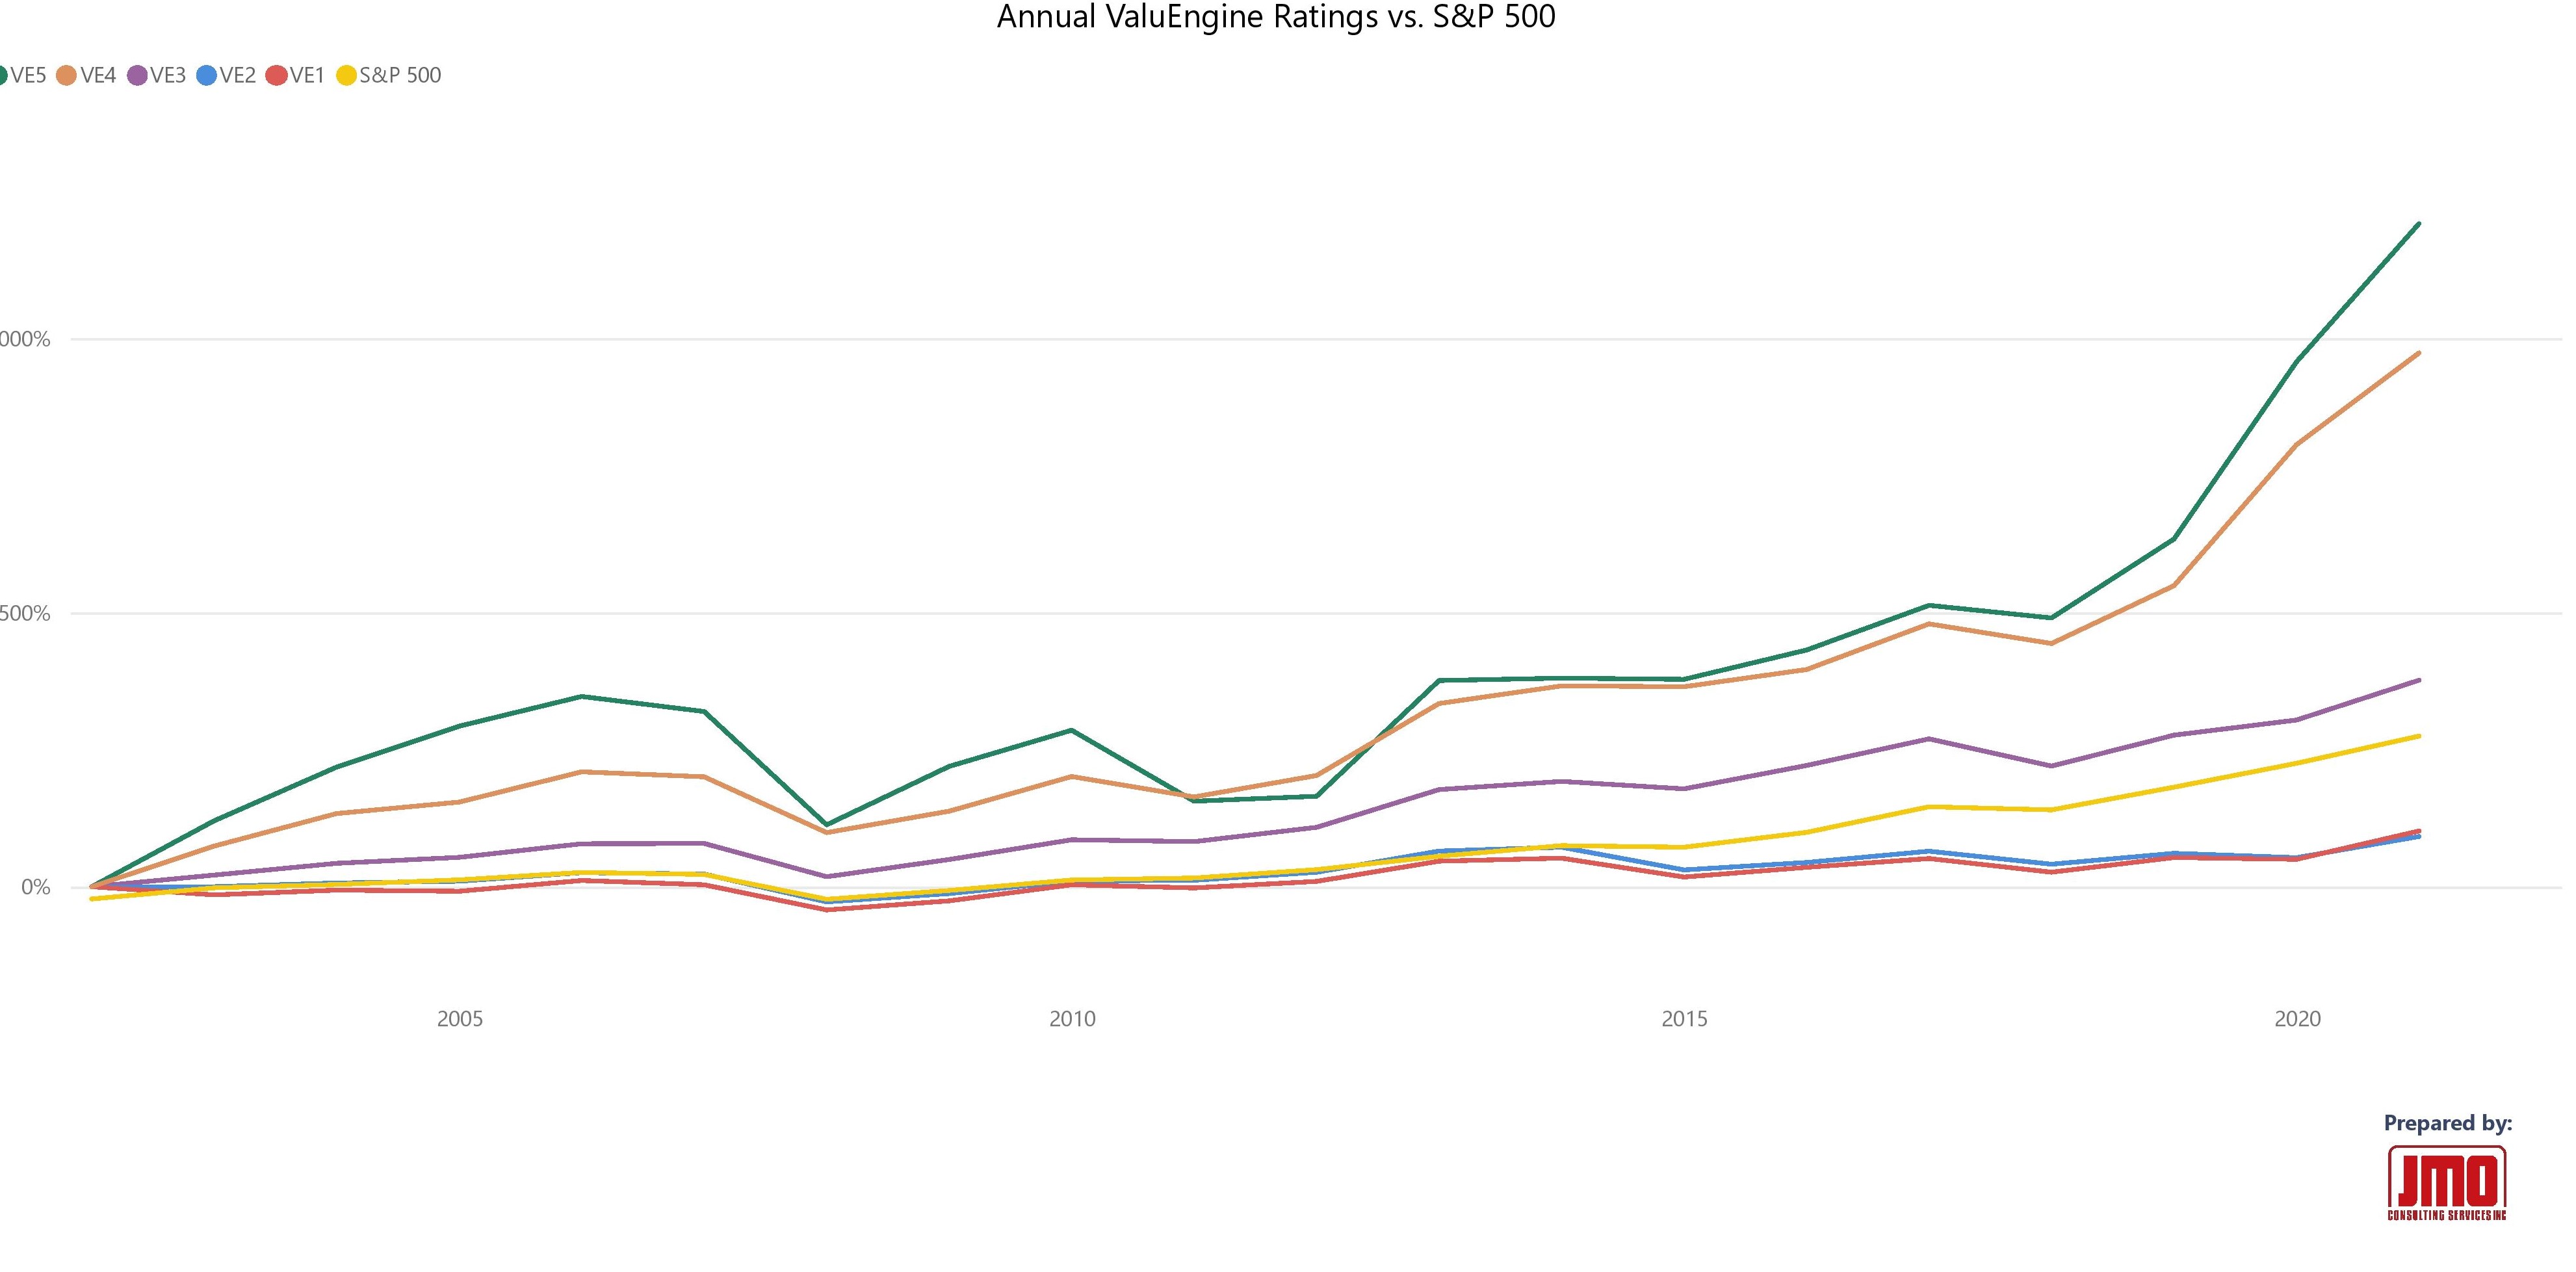
Above you can see tables that provide the return figures for stocks in each of our ratings categories. As you can see, over time our recommended stocks provide much higher rates of return than either our "holds" or our "sells." This is just what you should expect from a predictive quantitative model.
Click Here for more backtesting results for the "Engine Rating" system.
After reviewing the back-test results outlined on this page, we encourage you to examine the live-tracked performance numbers and the current representative stocks for each of the popular Benchmark Portfolios. The strategies discussed on this page are also summarized
in the Strategy Library (additional research results are provided therein).
*******************************************************************************
The ValuEngine Stock Forecast Model
The
predictive variables used in ValuEngine forecasting models include: proprietary
and well-established forecasting variables derived from credible financial
research studies.
ValuEngine uses a distinct forecasting model for 6 time horizons and each of the 16 sectors that ValuEngine covers.
Our forecasting models capture several important tendencies that stock prices consistently exhibit
- Short-term price reversals.
- Intermediate-term momentum continuation.
- Long-term price reversals.
Short and long-term historic factors in the VE valuation model's calculation include past-valuation levels of the stock and its recent price-momentum factor relative to other stocks. These considerations, applied with the firm-specific variables, allow the model to differentiate a stock across sectors and within the company's own business-growth stages.
ValuEngine applies the most-advanced statistical techniques to ensure that our stock-return forecasts are as reliable as possible. In addition, we utilize a realistic econometric model for assessing the future-return prospects of every stock and portfolio. This econometric model also estimates the probability of a double in stock price as well as the probability of meeting and exceeding any given stock or equity portfolio investment target.
*******************************************************************************
The ValuEngine Portfolio Forecast Model
The ValuEngine Portfolio Forecast Model utilizes our forecasting models to estimate future returns for specific groupings of stocks, including industries, sectors, indices, or custom portfolios. We compute the future-return forecasts for each stock and then ValuEngine runs thousands of concurrent simulations for all of the stocks in your portfolio (subject to various econometric requirements). The VE Portfolio Forecast Model then calculates the most likely return forecast based upon the simulations.
The ValuEngine Portfolio Builder
ValuEngine's Portfolio Builder tool enables you to create a portfolio of stocks based on one of the following long term goals:
- Maximize the chance of meeting or exceeding an investment target.
- Minimize the chance of loss
- Mix the above objectives according to your level of risk tolerance
Choosing the first option will prompt the Portfolio Forecast Builder to create an aggressive yet risky portfolio aimed at maximum price appreciation with the concomitant higher risk associated with rapid growth.
Choosing the second option will prompt Portfolio Builder to search for a conservative mix of stocks that seeks to preserve capital.
Choosing the third option will prompt Portfolio Builder to create a balanced portfolio that will maximize potential gains and minimize potential losses.
Once you have specified an investment objective, the VE Portfolio Builder will utilize our forecasting models to estimate future returns for the individual stocks in your portfolio. It will then examine tens of thousands of possible capital allocation plans distributed across the stocks within your current portfolio. From the results of these simulations, the model will identify and display the most favorable stock allocation based upon your objectives. Additionally, the VE Portfolio Builder will inform you of the exact number of shares to buy or sell of each stock so that the resulting distribution will increase your chances of maximizing gain, minimizing loss, or both.
Every ValuEngine Valuation and Forecast model for the U.S. equities markets has been extensively back-tested.
ValuEngine's performance exceeds that of many well-known stock-picking styles. The below information contains research findings related to the U.S. market. A great deal of additional performance information is available on other pages of this website, or by contacting ValuEngine directly:
Email: support@ValuEngine.com
Tel: (321) 325-0519
After reviewing the back-test results outlined on this page, we encourage you to examine
the live performance numbers.
The strategies discussed on this page are also summarized in the Strategy Library.
*******************************************************************************
Overview
The ValuEngine Research Findings page explores the following research topics:
- Test Methodology
- Results for the VE Forecasting Models
*******************************************************************************
Test Methodology
The back-testing of our Stock Valuation Model involves applying our strategies to a more than fifteen-year historical period. In order to maintain the integrity of the back-test, great care was taken to avoid survivorship bias, data-snooping bias, forward-looking bias, or any other leakage of non-contemporary data into the test. Only best of class, industry leading databases were used including data from Thomson Financial and Standard and Poor's.
In other words, our back-test of the valuation model used ONLY data that would have been accessible by an investor or analyst at the instant on the timeline when a stock was deemed to be overvalued, undervalued, or removed from consideration. For example, only the book/market ratio of each stock in March 1988 was used to determine which stocks should be bought or sold on a book/market strategy at that time.
This "out-of-sample" rule is rigorously applied to each model or strategy being researched. By "out-of-sample" tests, we mean that ValuEngine never uses any information that was available after a particular forecasting/portfolio-formation date to determine how to conduct forecasting or how to invest on that date. We have done out-of-sample
tests by running out-of-sample forecasting-regression analysis and forming investment strategies out-of-sample.
We perform forecasting-regression analysis and investment-strategies analysis because they capture different aspects of the model. The regression analysis shows the statistical significance of the model's performance, whereas the return numbers from the investment strategies show the economic significance in dollars and cents. This allows ValuEngine models to avoid situations where the statistical significance is great but there is little economic value.
Our back-testing and accompanying studies start from January, 1991.
- For detailed historical performance on ValuEngine's library of specific strategies, please visit
ValuEngine Portfolios.
- For additional, generalized performance back-tests and tracking, please visit
Research Findings.
|