| |
Home |
About Us & VE Models |
Products & Sign Up |
My Account
|
|||
| ||||
 |
||||||||||||||||||||||||||||||||||||||||||||||||||||||||||||||||||||||||||||||||||||||||||||||||||||||||||||||||||||||||||||||||||||||||||||||||||||||||||||||||||||||||||||||||||||||||||||||||||||||||||||||||||||||||||||||||||||||||||||||||||||||||||||||||||||||||||||||||||||||||||||||||||||||||||||||||||||||||||||||||||||||||||||||||||||||||||||||||||||||||||||||||||||||||||||||||||||||||||||||||||||||||||||||||||||||||||||||||||
Top-Five Consumer Staples Stocks--Long-Term Forecast Returns
Top-Five Consumer Staples Stocks--Composite Score
Top-Five Consumer Staples Stocks--Most Overvalued
Find out what Wall Street Investment and Media Professionals already know,
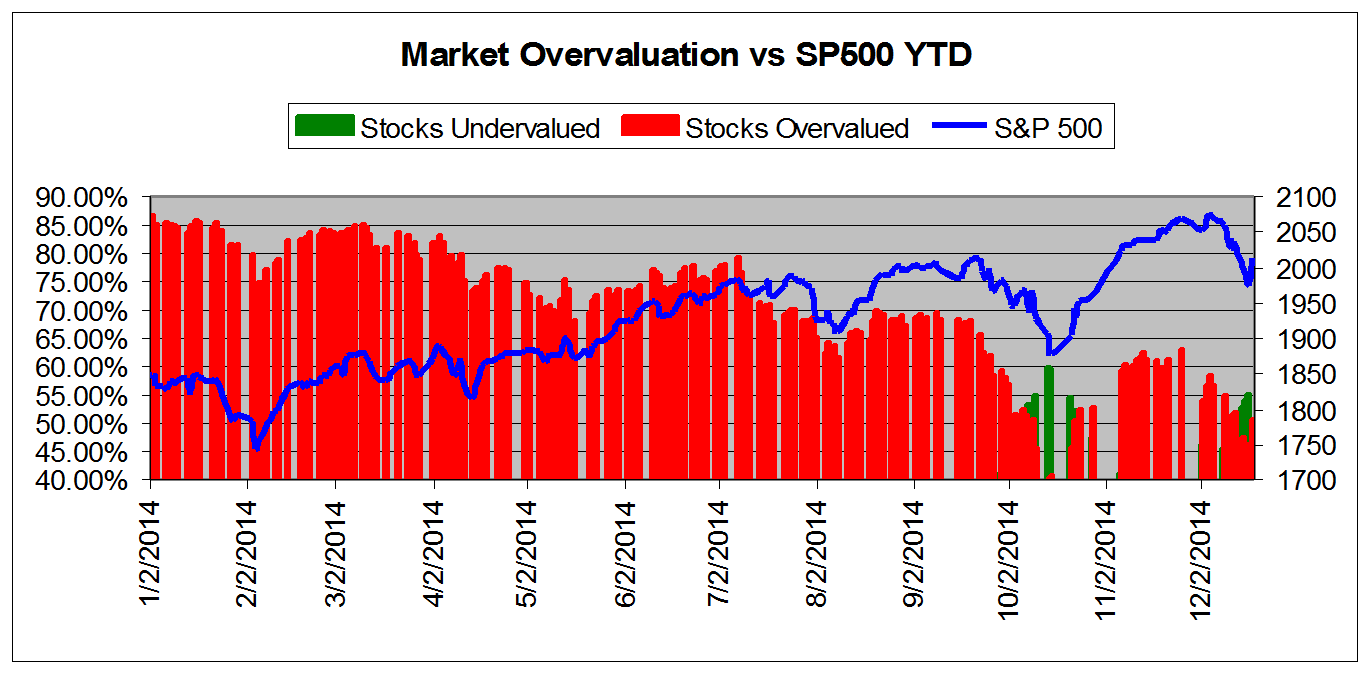
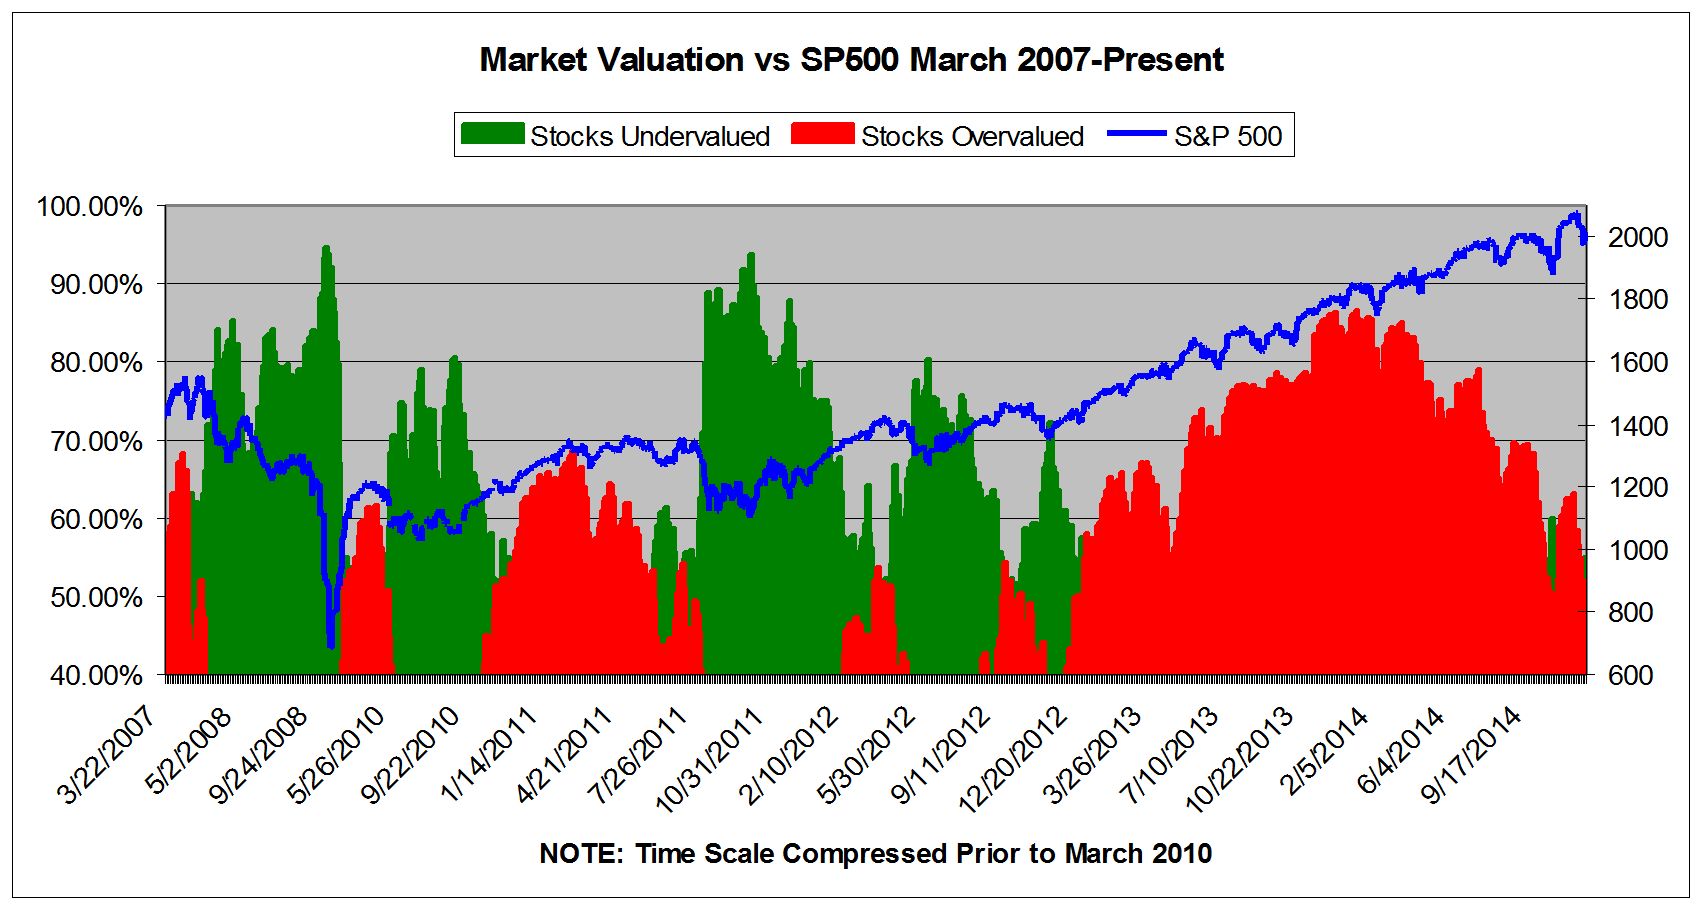
What's Hot--With Latest Market Unrest, Valuations in "Normal" Range AgainValuEngine tracks more than 7000 US equities, ADRs, and foreign stock which trade on US exchanges as well as @1000 Canadian equities. When EPS estimates are available for a given equity, our model calculates a level of mispricing or valuation percentage for that equity based on earnings estimates and what the stock should be worth if the market were totally rational and efficient--an academic exercise to be sure, but one which allows for useful comparisons between equities, sectors, and industries. Using our Valuation Model, we can currently assign a VE valuation calculation to more than 2900 stocks in our US Universe. We combine all of the equities with a valuation calculation to track market valuation figures and use them as a metric for making calls about the overall state of the market. Two factors can lower these figures-- a market pullback, or a significant rise in EPS estimates. Vice-versa, a significant rally or reduction in EPS can raise the figure. Whenever we see overvaluation levels in excess of @ 65% for the overall universe and/or 27% for the overvalued by 20% or more categories, we issue a valuation warning. We now calculate that 53.95% of stocks are overvalued and 18.42% of those stocks are overvalued by 20% or more. We saw overvaluation figures as low as 45% earlier this week. These sorts of figures are down significantly from where they were for much of 2014. With these sorts of numbers, we now operate well within "normal" range for valuation. We saw a brief dip into the 40s during October during the pre-election ISIS/Ebola scare, but other than that, the last time overvaluation hit levels in the 40s on a sustained basis was December 2012-- when the S&P 500 was in the 1400s. The crash in oil prices has unsettled the markets, and volatility has returned at a time when money managers should be padding their results for the year with a traditional holiday uptick. We keep getting good economic news in the US, and are especially optimistic due to the--finally--improving labor picture. But the ruble crisis and the energy chaos has hurt equities, and the US may be effected by this contagion. For this reason, we cannot use the valuation figures to make a buy call just yet despite the vastly improved valuation picture. Subscribers Get FULL ACCESS to our Market and Sector Overviews The chart below tracks the valuation metrics from January 2014. It shows levels in excess of 40%.
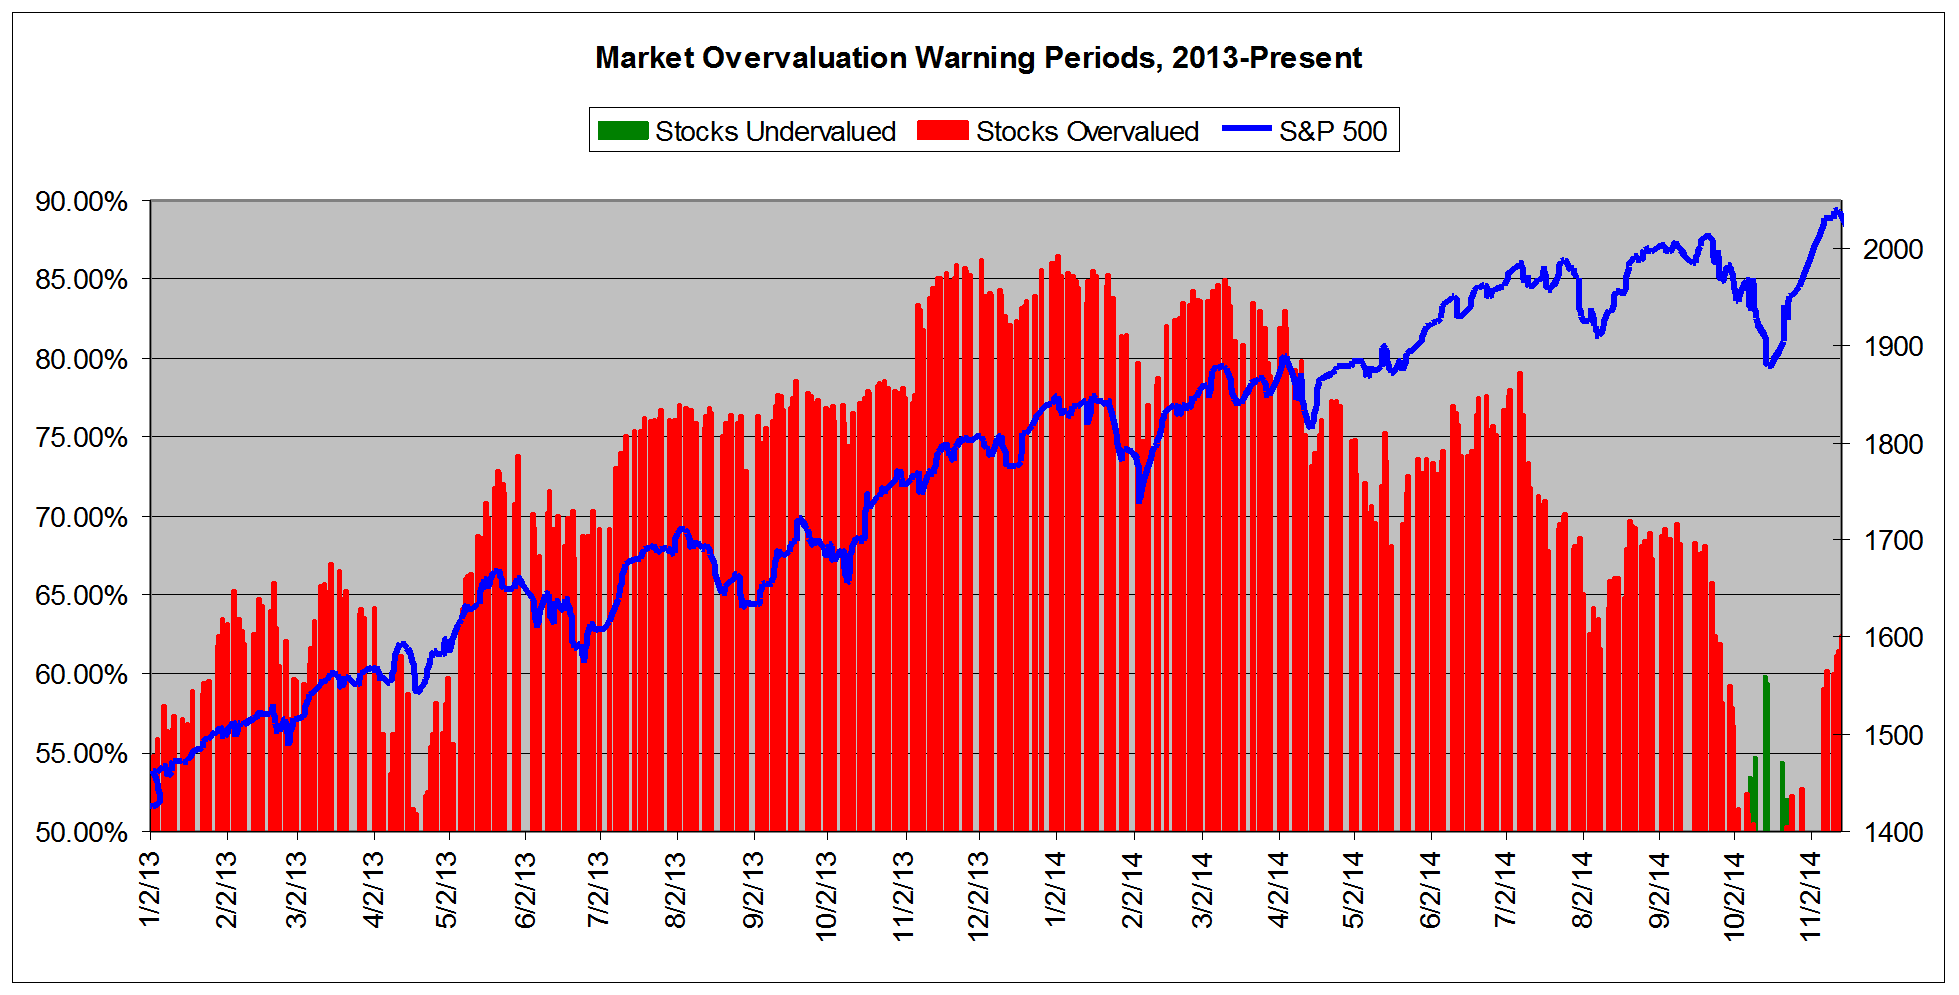
This chart shows overall universe over valuation in excess of 40% vs the S&P 500 from January 2013
This chart shows overall universe under and over valuation in excess of 40% vs the S&P 500 from March 2007*
In addition to the overall valuation metrics, we see that on a sector basis overvaluation has greatly declined. Only eleven sectors are overvalued according to our Valuation Model, and only one of them is overvalued by double digits. Oils/Energy is now calculated to be undervalued by almost 25%. Want To Know More About Our ValuEngine View Newsletter? Looking for a monthly portfolio of stock picks which are objective and based on cutting-edge academic theory and Wall St.practice? Then subscribe to The ValuEngine View Newsletter.The ValuEngine View Portfolio is based on our highly-refined and tested ValuEngine Portfolio Strategies along with our proprietary quant-based composite scoring system. The ValuEngine View Newsletter is the product of sophisticated stock valuation and forecast models first developed by Yale Professor of Finance Zhiwu Chen. The ValuEngine View Newsletter is the product of a sophisticated stock valuation model that was first developed by ValuEngine's academic research team. It utilizes a three factor approach: fundamental variables such as a company's trailing 12-month Earnings-Per-Share (EPS), the analyst consensus estimate of the company's future 12-month EPS, and the 30-year Treasury yield are all used to create a more accurate reflection of a company's fair value. A total of eleven additional firm specific variables are also used. In addition, the portoflio uses top picks from our Forecast Model. In essence, the portfolio is constructed with the best picks from our main propiretary models Each month you will receive an electronic copy of our newsletter highlighting 15 potential long positions along with five alternate picks. Our investment strategies focus on dozens of fundamental and technical factors for over 8000 individual stocks, synthesize the data, and then come up with a portfolio. Each newsletter portfolio focuses on maximum potential returns so there are no diversity requirements. Each portfolio pick includes critical ValuEngine valuation and forecast data. These 20 total picks represent the most up-to-date equity assessments of our proprietary models. Please click HERE to subscribe. You may download a sample copy HERE. After your subscription is approved, you will immediately receive access to download the current issue of newsletter as well as the previous issues, which are all available as PDF files. Each month when the latest issue of the newsletter is released, we will send you an email, informing you to download it from the site. The newsletter is released near the middle of each month.
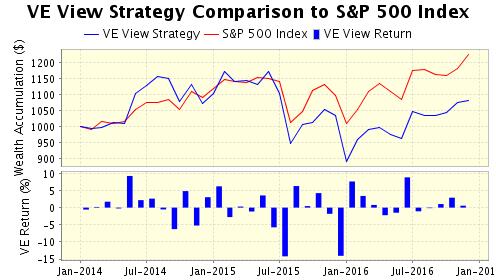
The ValuEngine View Newsletter is derived from the ValuEngine Aggressive and Diversified Growth Benchmark CLICK HERE to Subscribe to the ValuEngine View The ValuEngine View Newsletter portfolio has 15 primary stock picks and five alternates and is re-balanced once each month. The ValuEngine View Newsletter is published near the middle of each calendar month. An equal amount of capital is allocated to each stock. The monthly returns are calculated from the closing prices on date of publication. The performance calculation does not include any transaction costs. If you no longer wish to receive this free newsletter, CLICK HERE to unsubscribe |
|
|||||||||||||||||||||||||||||||||||||||||||||||||||||||||||||||||||||||||||||||||||||||||||||||||||||||||||||||||||||||||||||||||||||||||||||||||||||||||||||||||||||||||||||||||||||||||||||||||||||||||||||||||||||||||||||||||||||||||||||||||||||||||||||||||||||||||||||||||||||||||||||||||||||||||||||||||||||||||||||||||||||||||||||||||||||||||||||||||||||||||||||||||||||||||||||||||||||||||||||||||||||||||||||||||||||||||||||||||
 |
||||||||||||||||||||||||||||||||||||||||||||||||||||||||||||||||||||||||||||||||||||||||||||||||||||||||||||||||||||||||||||||||||||||||||||||||||||||||||||||||||||||||||||||||||||||||||||||||||||||||||||||||||||||||||||||||||||||||||||||||||||||||||||||||||||||||||||||||||||||||||||||||||||||||||||||||||||||||||||||||||||||||||||||||||||||||||||||||||||||||||||||||||||||||||||||||||||||||||||||||||||||||||||||||||||||||||||||||||

Testimonials | Press & News | B2B Partners | Privacy & Security Statement | Disclaimer
Analyst research and earnings information provided by IBES. Financial data provided by CapitalIQ.
Copyright 1998-2010 ValuEngine Inc. All Rights Reserved.