October 24, 2014
The ValuEngine
Weekly is an Investor Education newsletter focused on the
quantitative approach to investing and the tools available
from ValuEngine.com. In today's fast-moving and globalized financial markets, it is easy to get overloaded with information.
The winners will adopt an objective, scientific,
independent and unemotional approach to investing. If you
are not yet a member of ValuEngine's stock analysis service,
sign up now for a free trial at www.valuengine.com!
If the tables, charts, or other content in this email version of the newsletter do not display properly, please download the HTML version from
ValuEngine.com HERE or the PDF version from SCRIBD.com HERE
If you no longer wish to receive this free newsletter,
CLICK HERE to unsubscribe |
Our Valuation WARNING is OFF: Valuation is now well within "normal" range. Overvalued stocks now make up 52.21% of our stocks assigned a valuation and 15.09% of those equities are calculated to be overvalued by 20% or more. Ten sectors are calculated to be overvalued.
ValuEngine Index Overview
|
|
|
|
|
|
DJIA |
16373.15 |
16773.3 |
400.15 |
2.44% |
-1.21% |
NASDAQ |
4254.16 |
4472.16 |
218 |
5.12% |
2.62% |
RUSSELL 2000 |
1078.68 |
1113.66 |
34.98 |
3.24% |
-6.14% |
S&P 500 |
1885.62 |
1961.26 |
75.64 |
4.01% |
2.45% |
ValuEngine Market Overview
Summary of VE Stock Universe |
Stocks Undervalued |
47.79% |
Stocks Overvalued |
52.21% |
Stocks Undervalued by 20% |
17.29% |
Stocks Overvalued by 20% |
15.09% |
ValuEngine Sector Overview
ValuEngine Newsletters Latest Results
VE Newsletter |
Current Results |
S&P 500 |
Last Month Total |
S&P 500 |
Since Inception |
S&P 500 |
|
-2.26 |
1.98 |
4.46 |
-5.36 |
105.54 |
88.57 |
|
2.32 |
-2.18 |
-4.71 |
-0.18 |
22.73 |
25.67 |
|
-5.93 |
-4.19 |
-2.36 |
1.25 |
21.99 |
38.95 |
|
-0.78 |
-0.73 |
-6.26 |
-2.89 |
114.77 |
71.42 |
ValuEngine's Newsletters Beat the Market
With our Investment Newsletters, Subscribers Harness the Power of all of ValuEngine.com's Extensively Tracked and Tested Portfolio Strategies in an Easy to Follow Format.
Let ValuEngine Optimize your Portfolio and Provide Rational Advice for Smarter Investing
Click HERE to Check Out ValuEngine's Investment Newsletters
Free Download for Readers
As a bonus to our Free Weekly Newsletter subscribers,
we are offering a FREE DOWNLOAD of one of our Stock Reports
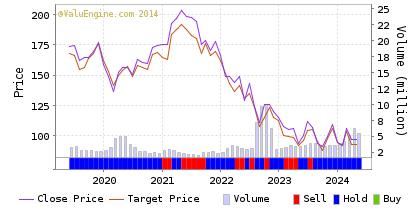
3M Company (MMM) is a diversified technology company with leading positions in consumer and office; display and graphics; electronics and telecommunications; health care; industrial; safety, security and protection services; transportation and other businesses. They are an integrated enterprise characterized by substantial intercompany cooperation in research, manufacturing and marketing of products.
3M is another earnings week success story. The company posted excellent numbers yesterday and provided a nice beat with Q3 profits up almost six percent. CEO Inge Thulin noted that much of the good news was based on US sales, where a strong economy helped product lines related to auto, aircraft, and electronic manufacturing. She also noted a boost from the sale of the company's protective dust and respiratory masks.
Despite the good news, ValuEngine continues its HOLD recommendation on 3M CO for 2014-10-23. Based on the information we have gathered and our resulting research, we feel that 3M CO has the probability to ROUGHLY MATCH average market performance for the next year. The company exhibits ATTRACTIVE Company Size but UNATTRACTIVE Book Market Ratio. Of course, as analysts update their earnings estimates to reflect the latest news, this rating could change.
Below is today's data on MMM:
ValuEngine Forecast |
| |
Target
Price* |
Expected
Return |
1-Month |
144.64 |
-0.28% |
3-Month |
144.09 |
-0.66% |
6-Month |
144.13 |
-0.64% |
1-Year |
140.10 |
-3.42% |
2-Year |
157.53 |
8.60% |
3-Year |
117.49 |
-19.00% |
Valuation & Rankings |
Valuation |
17.21% overvalued |
Valuation Rank(?) |
 19 |
1-M Forecast Return |
-0.28% |
1-M Forecast Return Rank |
29 |
12-M Return |
17.74% |
Momentum Rank(?) |
78 |
Sharpe Ratio |
0.76 |
Sharpe Ratio Rank(?) |
89 |
5-Y Avg Annual Return |
13.04% |
5-Y Avg Annual Rtn Rank |
77 |
Volatility |
17.24% |
Volatility Rank(?) |
87 |
Expected EPS Growth |
9.07% |
EPS Growth Rank(?) |
32 |
Market Cap (billions) |
94.90 |
Size Rank |
100 |
Trailing P/E Ratio |
19.92 |
Trailing P/E Rank(?) |
57 |
Forward P/E Ratio |
18.27 |
Forward P/E Ratio Rank |
33 |
PEG Ratio |
2.20 |
PEG Ratio Rank |
15 |
Price/Sales |
3.02 |
Price/Sales Rank(?) |
31 |
Market/Book |
10.76 |
Market/Book Rank(?) |
11 |
Beta |
1.11 |
Beta Rank |
46 |
Alpha |
-0.01 |
Alpha Rank |
65 |
As a bonus to our Newsletter readers,
we are offering a FREE DOWNLOAD of one of our Stock Reports
Read our Complete Detailed Valuation Report on 3M HERE.
Sector Talk--Construction
Below, we present the latest data on Construction stocks from our Institutional software package (VEI). Top five lists are provided for each category. We applied some basic liquidity criteria--share price greater than $3 and average daily volume in excess of 100k shares.
Please Click Here to Download a FREE Demo of ValuEngine's Professional VEI Software Package.
Top-Five Construction Stocks--Short-Term Forecast Returns
Ticker |
Name |
Mkt Price |
Valuation(%) |
Last 12-M Retn(%) |
MHO |
M/I HOMES INC |
21.92 |
-34.04 |
8.25 |
EME |
EMCOR GROUP INC |
41.9 |
-17.21 |
5.07 |
WLH |
WILLIAM LYON HM |
24.1 |
N/A |
1.73 |
CBI |
CHICAGO BRIDGE |
51.28 |
-35.77 |
-30.31 |
PWR |
QUANTA SERVICES |
32.47 |
-12.56 |
11.27 |
Top-Five Construction Stocks--Long-Term Forecast Returns
Ticker |
Name |
Mkt Price |
Valuation(%) |
Last 12-M Retn(%) |
MHO |
M/I HOMES INC |
21.92 |
-34.04 |
8.25 |
EME |
EMCOR GROUP INC |
41.9 |
-17.21 |
5.07 |
WLH |
WILLIAM LYON HM |
24.1 |
N/A |
1.73 |
CBI |
CHICAGO BRIDGE |
51.28 |
-35.77 |
-30.31 |
PWR |
QUANTA SERVICES |
32.47 |
-12.56 |
11.27 |
Top-Five Construction Stocks--Composite Score
Ticker |
Name |
Mkt Price |
Valuation(%) |
Last 12-M Retn(%) |
DHI |
D R HORTON INC |
22.94 |
-3.13 |
17.82 |
PWR |
QUANTA SERVICES |
32.47 |
-12.56 |
11.27 |
LEN |
LENNAR CORP -A |
43.31 |
-5.32 |
18.5 |
MHO |
M/I HOMES INC |
21.92 |
-34.04 |
8.25 |
EME |
EMCOR GROUP INC |
41.9 |
-17.21 |
5.07 |
Top-Five Construction Stocks--Most Overvalued
Ticker |
Name |
Mkt Price |
Valuation(%) |
Last 12-M Retn(%) |
WLDN |
WILLDAN GROUP |
13.41 |
99.64 |
265.4 |
AYI |
ACUITY BRANDS |
133.54 |
26.72 |
29.02 |
URS |
URS CORP |
54.2 |
24.57 |
-0.37 |
NCS |
NCI BLDG SYSTEM |
19.26 |
23.24 |
36.31 |
ACM |
AECOM TECH CORP |
31.97 |
14.28 |
-0.71 |
Find out what Wall Street Investment and Media Professionals already know,
ValuEngine offers sophisticated stock valuation and forecast research as well as a variety of portfolio screening and creation tools.
What's Hot
-- VE Dividend Strategy Posts Positive Gains Despite Roiled Markets
We still find a positive economic environment for equities within the United States. However, concern over a global economic slow down combined with overblown concerns about Ebola and ISIS within the US-- and efforts by some politicians and media figures dissatisfied with the Obama Administration to stoke those fears amongst investors prior to the US mid-term elections-- is not helping equities. As the latest results for our VE Dividend Stock Newsletter Portfolio show, we definitely saw a move into larger cap/defensive stocks over the past few weeks.
For September/October, we saw the return of volatility and a roller coaster market. Our portfolio however, performed admirably well as investor rediscovered the strength and safety of large-cap/dividend paying stocks. We handily beat the S&P 500s loss of 2.18% by a significant margin and posted a gain of 2.32%. That's a nice spread of 450 bps. The LTM return of our portfolio is 10.39% vs the S&P 500 LTM return of 11.18%. Since inception, the return for the VE Dividend Stock Newsletter is 22.73% versus the S&P's gain of 25.67%.
We had a 66% hit rate for the month with losers—with the exception of Potash Saskatchewan-- posting declines of less than 5%. Our winners also posted fairly modest gains, with only Alexandria Real Estate breaking into double-digit territory. Still, it was nice to see some good news amidst the carnage that occurred around the middle of the rebalance period.
Here are the latest VE Dividend Stock Newsletter Portfolio Results:
| Ticker |
Company Name |
Entry Price 9/23/14 |
Exit Price |
Change |
%Change |
| ARE |
ALEXANDRIA REAL ESTATE |
73.66 |
82.52 |
8.86 |
12.03 |
| BGS |
B&G FOODS CL-A |
27.95 |
27.94 |
-0.01 |
-0.04 |
| BMR |
BIOMED REALTY TRUST |
20.33 |
21.85 |
1.52 |
7.48 |
| BRC |
BRADY CORPORATION |
22.56 |
22.01 |
-0.55 |
-2.44 |
| CBL |
CBL&ASSOCIATES PROPERTIES |
17.95 |
18.71 |
0.76 |
4.23 |
| CMO |
CAPSTEAD MORTGAGE |
12.55 |
12.82 |
0.27 |
2.15 |
| MAA |
MID-AMERICAN APT CM |
65.72 |
70.07 |
4.35 |
6.62 |
| MFA |
MFA FINANCIAL |
7.88 |
8.31 |
0.43 |
5.46 |
| PCG |
PG&E CORP |
44.73 |
46.19 |
1.46 |
3.26 |
| POT |
POTASH SASKATCHEWAN |
34.52 |
32.54 |
-1.98 |
-5.74 |
| PSEC |
PROSPECT CAPITAL |
9.98 |
9.64 |
-0.34 |
-3.41 |
| SRC |
SPIRIT REALTY TRUST |
10.97 |
11.64 |
0.67 |
6.11 |
| STWD |
STARWOOD PROPERTY TRUST |
22.3 |
22.36 |
0.06 |
0.27 |
| TWO |
TWO HARBORS INVESTMENT |
9.95 |
10.11 |
0.16 |
1.61 |
| VZ |
VERIZON COMMUNCIATIONS |
49.62 |
48.22 |
-1.4 |
-2.82 |
| |
LONG PORTFOLIO |
|
|
|
2.32 |
| GSPC |
S&P500 |
1994.29 |
1950.82 |
-43.47 |
-2.18 |
Want To Know More About Our Dividend Stock Newsletter?
The ValuEngine Dividend Stock Newsletter features 15 primary stock selection and five alternate stock picks derived from our award-winning stock forecast model. Stocks selected are the top forecast dividend-paying stocks for the next thirty days. Equities selected will pay dividends during the re-balance period which over time can help to boost portfolio performance.
Why Dividend Stocks? Dividend stocks allow investors to build a portfolio with large, stable, and profitable companies. The VE Dividend Stock Newsletter is designed to provide investors with satisfactory returns, low volatility, low trading costs, and the relative security of large cap stock investing along with the performance boost provided by capturing monthly, quarterly, and annual dividends.
Each month you will receive an electronic copy of our newsletter highlighting 15 potential long positions along with five alternate picks. Our investment strategies focus on dozens of fundamental and technical factors for over 8000 individual stocks, synthesize the data, and then come up with a portfolio. Each newsletter portfolio focuses on maximum potential returns so there are no diversity requirements. Each portfolio pick includes critical ValuEngine valuation and forecast data. These 20 total picks represent the most up-to-date equity assessments of our proprietary models.
Please click HERE to subscribe. After your subscription is approved, you will immediately receive access to download the current issue of newsletter as well as the previous issues, which are all available as PDF files. Each month when the latest issue of the newsletter is released, we will send you an email, informing you to download it from the site. The newsletter is released near the middle of each month, and each issue will inform you of the next publication date.

If you no longer wish to receive this free newsletter, CLICK HERE to unsubscribe
|


