| |
Home |
About Us & VE Models |
Products & Sign Up |
My Account
|
|||
| ||||
 |
||||||||||||||||||||||||||||||||||||||||||||||||||||||||||||||||||||||||||||||||||||||||||||||||||||||||||||||||||||||||||||||||||||||||||||||||||||||||||||||||||||||||||||||||||||||||||||||||||||||||||||||||||||||||||||||||||||||||||||||||||||||||||||||||||||||||||||||||||||||||||||||||||||||||||||||||||||||||||||||||||||||||||||||||||||||||||||||||||||||||||||||||||||||
Top-Five Consumer Discretionary Stocks--Long-Term Forecast Returns
Top-Five Consumer Discretionary Stocks--Composite Score
Top-Five Consumer Discretionary Stocks--Most Overvalued
Free Download for ReadersAs a bonus to our Free Weekly Newsletter subscribers, McDonald's Corporation (MCD) develops, operates, franchises and services a worldwide system of restaurants that prepare, assemble, package and sell a limited menu of value-priced foods. The company operates primarily in the quick-service hamburger restaurant business. All restaurants are operated by the company or, under the terms of franchise arrangements, by franchisees who are independent third parties, or by affiliates operating under joint-venture agreements between the company and local business people. ValuEngine continues its BUY recommendation on MCDONALDS CORP for 2016-05-12. Based on the information we have gathered and our resulting research, we feel that MCDONALDS CORP has the probability to OUTPERFORM average market performance for the next year. The company exhibits ATTRACTIVE Company Size and Sharpe Ratio. . Read our Complete Detailed Valuation Report on McDonald's HERE.
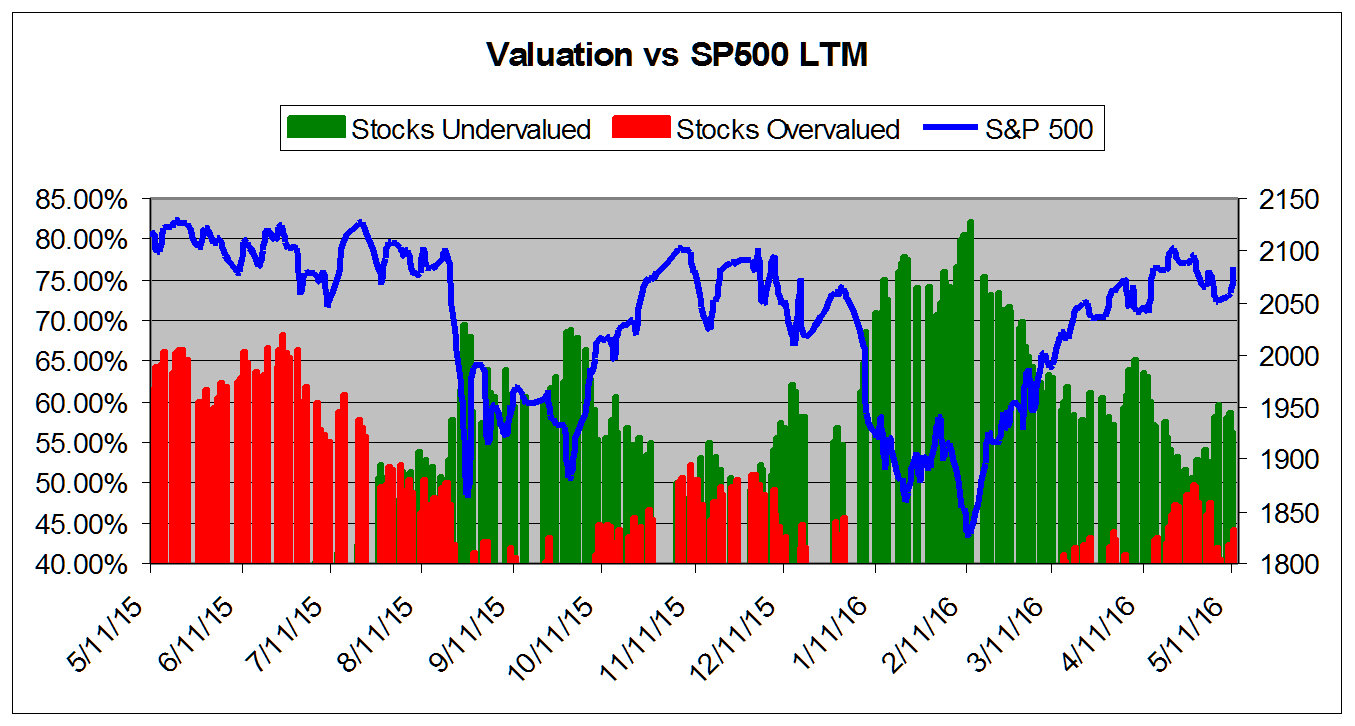
What's HotValuations Recover From DipValuEngine tracks more than 7000 US equities, ADRs, and foreign stock which trade on US exchanges as well as @1000 Canadian equities. When EPS estimates are available for a given equity, our model calculates a level of mispricing or valuation percentage for that equity based on earnings estimates and what the stock should be worth if the market were totally rational and efficient--an academic exercise to be sure, but one which allows for useful comparisons between equities, sectors, and industries. Using our Valuation Model, we can currently assign a VE valuation calculation to more than 2800 stocks in our US Universe. We combine all of the equities with a valuation calculation to track market valuation figures and use them as a metric for making calls about the overall state of the market. Two factors can lower these figures-- a market pullback, or a significant rise in EPS estimates. Vice-versa, a significant rally or reduction in EPS can raise the figure. Whenever we see overvaluation levels in excess of @ 65% for the overall universe and/or 27% for the overvalued by 20% or more categories, we issue a valuation warning. We now calculate that 41.6% of the stocks we can assign a valuation are overvalued and 13.63% of those stocks are overvalued by 20% or more. These numbers have climbed back into "normal" range since we published our valuation study in April-- when the overvaluation was at 36.99%. And of course, we have the gorilla in the room, the US presidential election. Often these elections prove to be correlated with decent stock markets. But, we have some giant uncertainties thanks to the GOP-nomation of Donald Trump. What so many "experts" said was impossible has, in fact, now happened. Regardless, our valuation figures show a "normal" market. The chart below tracks the valuation metrics from April 2015. It shows levels in excess of 40%.
This chart shows overall universe over valuation in excess of 40% vs the S&P 500 from April 2013
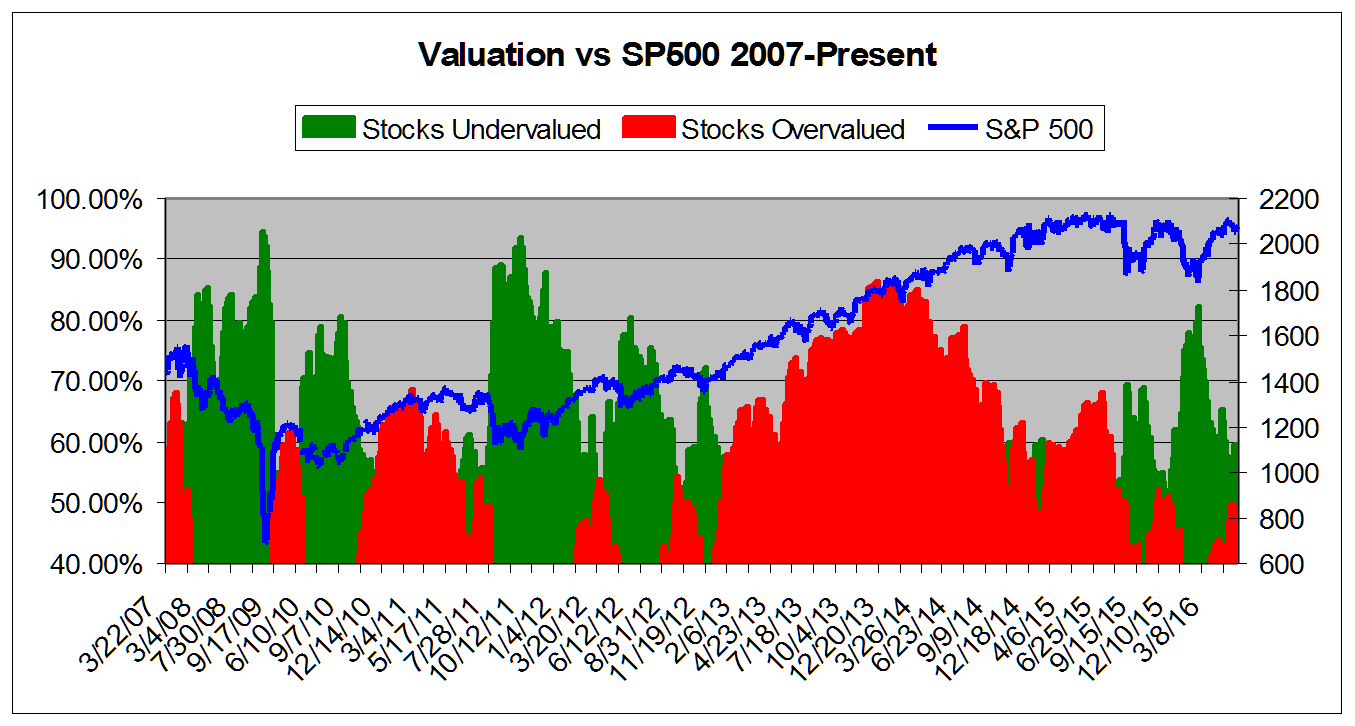
This chart shows overall universe under and over valuation in excess of 40% vs the S&P 500 from March 2007*
ValuEngine In The NewsEditor's Note: The Following Article Was Posted By WatersTechnology ValuEngine Bows Chinese-Language Reports Stock valuation and forecasting provider ValuEngine has begun producing Chinese-language versions of its daily stock reports, and has partnered with New York-based online broker SogoTrade, and set up a Hong Kong subsidiary to distribute the reports to Chinese institutions and investors. The vendor’s stock- and industry-level reports are created using an automated process that inserts data into pre-written blocks of text, selected by the program from a multitude of pre-written narrative choices based on the data. Last year, ValuEngine decided to begin producing Chinese-language reports to respond to demand from Chinese investors for access to investment opportunities in US stocks, and because several key company executives—founder Zhiwu Chen, vice president of research and development Yongjian Zhan, and Hong Kong-based investor Allen Huie—are Chinese, Henneman says. The vendor creates the Chinese reports in the same way as its English-language reports, by importing data into the same pre-written passages of text, translated into Chinese. ValuEngine provides both the English and Chinese versions to SogoTrade, along with two English-language monthly investment newsletters written by analyst and business development executive Steve Hach. Because these commentaries are written fresh each month, they cannot be automatically translated in the same way as the daily reports, so ValuEngine provides these in English for SogoTrade to translate for its Chinese-speaking clients. “A focus of SogoTrade is Chinese investors in the US, and much of its user base is native Chinese speakers, so it has staff whose function is specifically to translate content into Chinese,” Henneman says. In addition, ValuEngine will also make its reports available via ValuEngine Asset Management, a Hong Kong-based asset management firm owned by ValuEngine’s investors and headed by managing director Huie, and will leverage his contacts and local expertise gained over 30 years of experience in the investment banking and finance industries to promote the reports. Though the vendor is primarily seeking to distribute its Chinese-language research via distribution partners, Henneman says the reports provide even greater value when combined with a full-service asset management business that can execute the strategies on behalf of investors, such as Evaluated Capital Management, the US full-service investment firm that ValuEngine set up earlier this year. In the future, ValuEngine plans to expand its coverage to provide stock reports for other markets by replicating the same automated model. “It takes work, but we can adapt our model for any market,” he says, adding that the vendor already provides reports for Canadian stocks. “Ultimately, we want to cover all the major markets, each in multiple languages.” BY MAX BOWIE APRIL 18, 2016
ValuEngineCapital Money Management ServicesWe are pleased to announce that ValuEngine Capital has begun trading for our clients. ValuEngine Capital, a registered investment advisory firm, offers our clients investment-management services based on industry-leading ValuEngine research. ValuEngine Capital melds the cutting-edge financial theory of ValuEngine's award-winning quantitative independent research with the best real-world Wall St. practices. ValuEngine Capital offers refined investment portfolios for investors of all risk-reward profiles. ValuEngine Capital is offering three investment strategies to clients, the ValuEngine View Strategy, the ValuEngine Market Neutral Strategy, and the ValuEngine Diversified Strategy. ValuEngine View Strategy: The ValuEngine View Strategy is the product of a sophisticated stock valuation model that was first developed by ValuEngine's academic research team. It utilizes a three factor approach: fundamental variables such as a company's trailing 12-month Earnings-Per-Share (EPS), the analyst consensus estimate of the company's future 12-month EPS, and the 30-year Treasury yield are all used to create a more accurate reflection of a company's fair value. A total of eleven additional firm specific variables are also used. The ValuEngine View portfolio is constructed by integrating both our Aggressive Growth—based on the Valuation Model--and Diversified Growth—based on the Forecast Model-- Portfolio Strategies. The ValuEngine View Strategy is constructed by integrating this model along with some basic rules for market capitalization and industry diversification. The portfolio has 15 stocks and is rebalanced once each month. Professional Portfolio Management Services
ValuEngine Market Neutral Strategy: The ValuEngine Market Neutral Strategy is the product of ValuEngine's Forecast Model. This model was developed by a team of PhD's and is based on the cutting edge economic theories of Wall Street professionals and Ivy League academics. We carefully examine dozens of fundamental and technical factors for over 8,000 individual stocks, synthesize the data, and then come up with a sector-diverse list of our best and worst forecast 1-month return stocks. Short and long-term historic factors in the VE Forecast model's calculation include past-valuation levels of the stock and its recent price-momentum factor relative to other stocks. The ValuEngine Market Neutral Strategy utilizes Forecast Model outputs along with market capitalization, price, and sector diversification rules to construct a monthly portfolio made up of 16 stocks for both the long and short sides. Strategies To Suit All Investor Types The ValuEngine Diversified Strategy: The ValuEngine Diversified Strategy invests in a variety of asset classes in order to provide investors with stable returns and a high- dividend yield coupled with significantly lower risk than single-asset products. The ValuEngine Diversified Strategy may include ETFs focused on commodities, stock indices, REITS, bonds, emerging markets, and other suitable products. By reaping the benefits of diversification, the ValuEngine Diversified Strategy seeks to remain resilient during times of market volatility. The ValuEngine Diversified Strategy is designed for investors seeking management for their IRA and other retirement funds as well as those whose risk-profile is not suitable for our other strategies. For more information, please contact us by email at info@ValuEngineCapital.com or by phone at (407) 308-5686. ValuEngine.com is an independent research provider, producing buy/hold/sell recommendations, target price, and valuations on over 7,000 US and Canadian equities every trading day. Visit www.ValuEngine.com for more information
If you no longer wish to receive this free newsletter, CLICK HERE to unsubscribe |
|
|||||||||||||||||||||||||||||||||||||||||||||||||||||||||||||||||||||||||||||||||||||||||||||||||||||||||||||||||||||||||||||||||||||||||||||||||||||||||||||||||||||||||||||||||||||||||||||||||||||||||||||||||||||||||||||||||||||||||||||||||||||||||||||||||||||||||||||||||||||||||||||||||||||||||||||||||||||||||||||||||||||||||||||||||||||||||||||||||||||||||||||||||||||
 |
||||||||||||||||||||||||||||||||||||||||||||||||||||||||||||||||||||||||||||||||||||||||||||||||||||||||||||||||||||||||||||||||||||||||||||||||||||||||||||||||||||||||||||||||||||||||||||||||||||||||||||||||||||||||||||||||||||||||||||||||||||||||||||||||||||||||||||||||||||||||||||||||||||||||||||||||||||||||||||||||||||||||||||||||||||||||||||||||||||||||||||||||||||||


Testimonials | Press & News | B2B Partners | Privacy & Security Statement | Disclaimer
Analyst research and earnings information provided by IBES. Financial data provided by CapitalIQ.
Copyright 1998-2010 ValuEngine Inc. All Rights Reserved.