July 22, 2016
If the tables, charts, or other content in this email version of the newsletter do not display properly, please download the HTML version from
ValuEngine.com HERE |
VALUATION WATCH: Overvalued stocks now make up 45.63% of our stocks assigned a valuation and 14.99% of those equities are calculated to be overvalued by 20% or more. Six sectors are calculated to be overvalued.
ValuEngine Index Overview
|
|
|
|
|
|
DJIA |
18521.55 |
18372.1 |
-149.45 |
-0.81% |
5.44% |
NASDAQ |
5034.99 |
5091.54 |
56.55 |
1.12% |
1.68% |
RUSSELL 2000 |
1205.29 |
1208.63 |
3.34 |
0.28% |
6.40% |
S&P 500 |
2162.04 |
2168.95 |
6.91 |
0.32% |
6.12% |
ValuEngine Market Overview
Summary of VE Stock Universe |
Stocks Undervalued |
54.37% |
Stocks Overvalued |
45.63% |
Stocks Undervalued by 20% |
23% |
Stocks Overvalued by 20% |
14.99% |
ValuEngine Sector Overview
Sector Talk--Finance
Below, we present the latest data on Finance stocks from our Professional Stock Analysis Service Top five lists are provided for each category. We applied some basic liquidity criteria--share price greater than $3 and average daily volume in excess of 100k shares. We have been following the sector closely of late because it has been correlated so tightly to overall equity price moves.
Top-Five Finance Stocks--Short-Term Forecast Returns
Ticker |
Name |
Mkt Price |
Valuation (%) |
Last 12-M Return (%) |
ELRC |
ELECTRO-RENT |
15.49 |
N/A |
49.95% |
GGAL |
GRUPO GALIC ADR |
30.51 |
N/A |
52.63% |
LGIH |
LGI HOMES INC |
34.77 |
N/A |
84.95% |
ORC |
ORCHID ISLAND |
10.91 |
N/A |
26.57% |
EIG |
EMPLOYERS HLDGS |
30.76 |
-10.22% |
30.89% |
Top-Five Finance Stocks--Long-Term Forecast Returns
Ticker |
Name |
Mkt Price |
Valuation (%) |
Last 12-M Return (%) |
ELRC |
ELECTRO-RENT |
15.49 |
N/A |
49.95% |
GGAL |
GRUPO GALIC ADR |
30.51 |
N/A |
52.63% |
LGIH |
LGI HOMES INC |
34.77 |
N/A |
84.95% |
ORC |
ORCHID ISLAND |
10.91 |
N/A |
26.57% |
EIG |
EMPLOYERS HLDGS |
30.76 |
-10.22% |
30.89% |
Top-Five Finance Stocks--Composite Score
Ticker |
Name |
Mkt Price |
Valuation (%) |
Last 12-M Return (%) |
NLY |
ANNALY CAP MGMT |
10.8 |
-9.07% |
10.54% |
EIG |
EMPLOYERS HLDGS |
30.76 |
-10.22% |
30.89% |
GOV |
GOVT PPTYS INCM |
22.83 |
-6.17% |
19.72% |
PRI |
PRIMERICA INC |
52.33 |
-11.35% |
16.13% |
SNH |
SENIOR HOUSING |
21.71 |
-1.46% |
25.20% |
Top-Five Finance Stocks--Most Overvalued
Ticker |
Name |
Mkt Price |
Valuation (%) |
Last 12-M Return (%) |
AXP |
AMER EXPRESS CO |
63.43 |
91.11% |
-19.66% |
BCS |
BARCLAY PLC-ADR |
8.06 |
69.93% |
-53.97% |
EZPW |
EZCORP INC CL A |
9.15 |
59.25% |
43.98% |
IBKR |
INTERACTIVE BRK |
34.52 |
51.11% |
-23.20% |
DRE |
DUKE REALTY CP |
27.45 |
36.95% |
39.20% |
Free Download for Readers
As a bonus to our Free Weekly Newsletter subscribers,
we are offering a FREE DOWNLOAD of one of our Stock Reports
Twenty-First Century Fox, Inc. (FOX) is involved in creating and distributing media services. Its business portfolio consists of cable, broadcast, film, pay TV and satellite assets. Twenty-First Century Fox, Inc., formerly known as News Corporation, is based in New York, United States.
VALUENGINE RECOMMENDATION: ValuEngine continues its HOLD recommendation on TWENTY-FIRST CF for 2016-07-21. Based on the information we have gathered and our resulting research, we feel that TWENTY-FIRST CF has the probability to ROUGHLY MATCH average market performance for the next year. The company exhibits ATTRACTIVE Company Size but UNATTRACTIVE Book Market Ratio.
Read our Complete Detailed Valuation Report on Twenty-First Century Fox HERE.
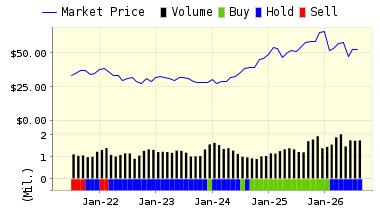
ValuEngine Forecast |
| |
Target
Price* |
Expected
Return |
1-Month |
27.67 |
-0.18% |
3-Month |
28.06 |
1.23% |
6-Month |
28.65 |
3.36% |
1-Year |
27.12 |
-2.16% |
2-Year |
33.20 |
19.77% |
3-Year |
34.37 |
24.00% |
Valuation & Rankings |
Valuation |
n/a |
Valuation Rank(?) |
 n/a |
1-M Forecast Return |
-0.18% |
1-M Forecast Return Rank |
35 |
12-M Return |
-15.36% |
Momentum Rank(?) |
36 |
Sharpe Ratio |
0.36 |
Sharpe Ratio Rank(?) |
79 |
5-Y Avg Annual Return |
8.20% |
5-Y Avg Annual Rtn Rank |
77 |
Volatility |
22.69% |
Volatility Rank(?) |
70 |
Expected EPS Growth |
25.65% |
EPS Growth Rank(?) |
63 |
Market Cap (billions) |
59.09 |
Size Rank |
99 |
Trailing P/E Ratio |
16.67 |
Trailing P/E Rank(?) |
71 |
Forward P/E Ratio |
13.26 |
Forward P/E Ratio Rank |
65 |
PEG Ratio |
0.65 |
PEG Ratio Rank |
53 |
Price/Sales |
2.20 |
Price/Sales Rank(?) |
42 |
Market/Book |
3.80 |
Market/Book Rank(?) |
31 |
Beta |
1.22 |
Beta Rank |
33 |
Alpha |
-0.19 |
Alpha Rank |
33 |
What's Hot
Valuations Back Up As Brexit Panic Fades
ValuEngine tracks more than 7000 US equities, ADRs, and foreign stock which trade on US exchanges as well as @1000 Canadian equities. When EPS estimates are available for a given equity, our model calculates a level of mispricing or valuation percentage for that equity based on earnings estimates and what the stock should be worth if the market were totally rational and efficient--an academic exercise to be sure, but one which allows for useful comparisons between equities, sectors, and industries. Using our Valuation Model, we can currently assign a VE valuation calculation to more than 2800 stocks in our US Universe.
We combine all of the equities with a valuation calculation to track market valuation figures and use them as a metric for making calls about the overall state of the market. Two factors can lower these figures-- a market pullback, or a significant rise in EPS estimates. Vice-versa, a significant rally or reduction in EPS can raise the figure. Whenever we see overvaluation levels in excess of @ 65% for the overall universe and/or 27% for the overvalued by 20% or more categories, we issue a valuation warning.
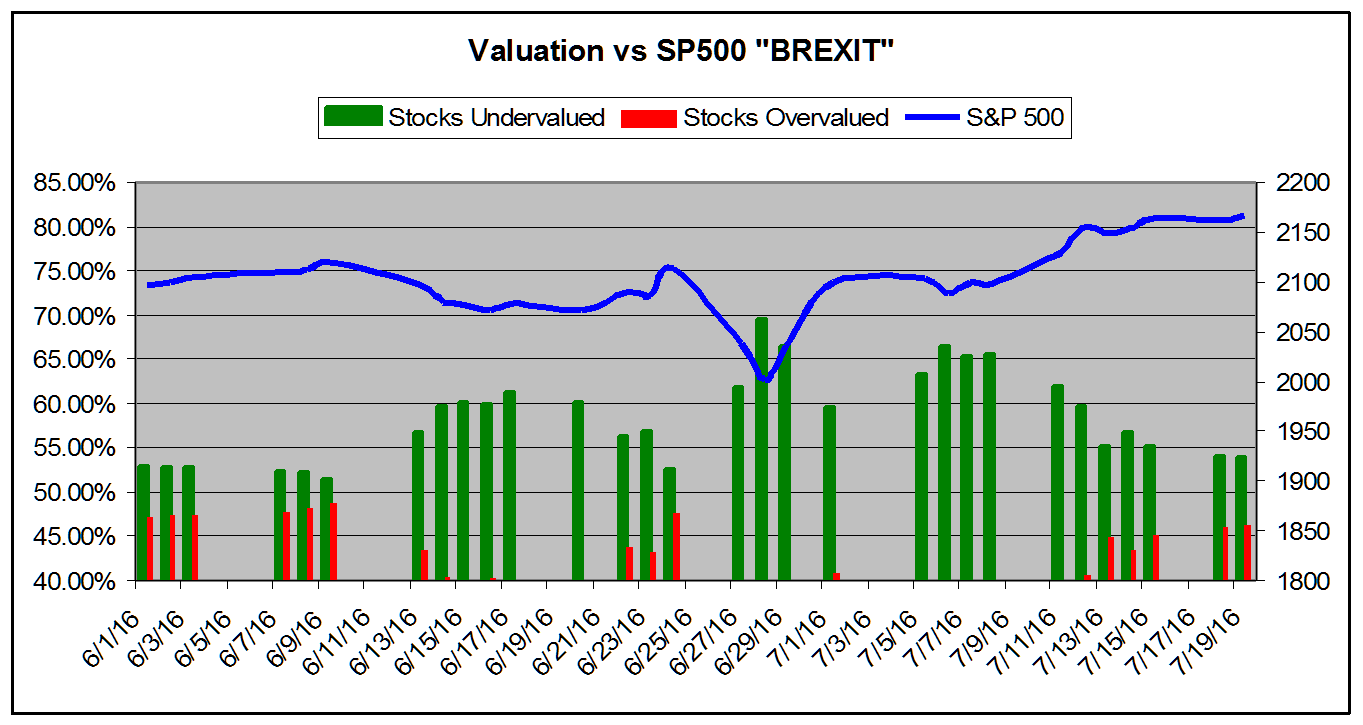
We now calculate that 45.6% of the stocks we can assign a valuation are overvalued and 14.99% of those stocks are overvalued by 20% or more. These numbers have increased-- slightly-- since we published our valuation study in June-- when the overvaluation was at 40%. That last study was published just a week before the Brexit vote.
Think back to the panic we saw soon after moment, with the doomsayers screaming that investors should SELL SELL SELL! Yet another illustration of the point that selling in the midst of crisis is typically the worst possible response for the long-term investor. At this point, that blip looks like little more than "noise." So, those who sold in the midst of that Brexit-induced panic locked in their losses.
And the markets in the US and elsewhere certainly shook off that Brexit panic, with several indices setting new records over the past few weeks. Many analysts found that the uncertainty in the EU removed any possible scenario where the Fed would raise rates any time soon. As always, that sort of sentiment provided a boost to equities.
Of course, that is not to say that some Fed officials don't favor increases, but the time to hit the brakes may have passed by given the fact that the US is in the midst of a presidential election, and the central bank is notoriously skittish about any hint of political bias.
We won't have a better sense of potential rate increases until after the next round of meetings later this month. If good data for the US and world economy holds up, the Fed may push for an increase in September. But again, we find that the labor market should still be given some room to run.
As always, and as we repeat like a mantra, the balancing act between the dual mandate of control inflation and foster full employment creates tension.
For now, our valuation figures still show a "normal" market, with valuations nowhere near that bargain level they presented in the immediate aftermath of the Brexit vote.
The chart below tracks the valuation metrics for June and July, 2016. It encompasses the Brexit sell off. It shows levels in excess of 40%.
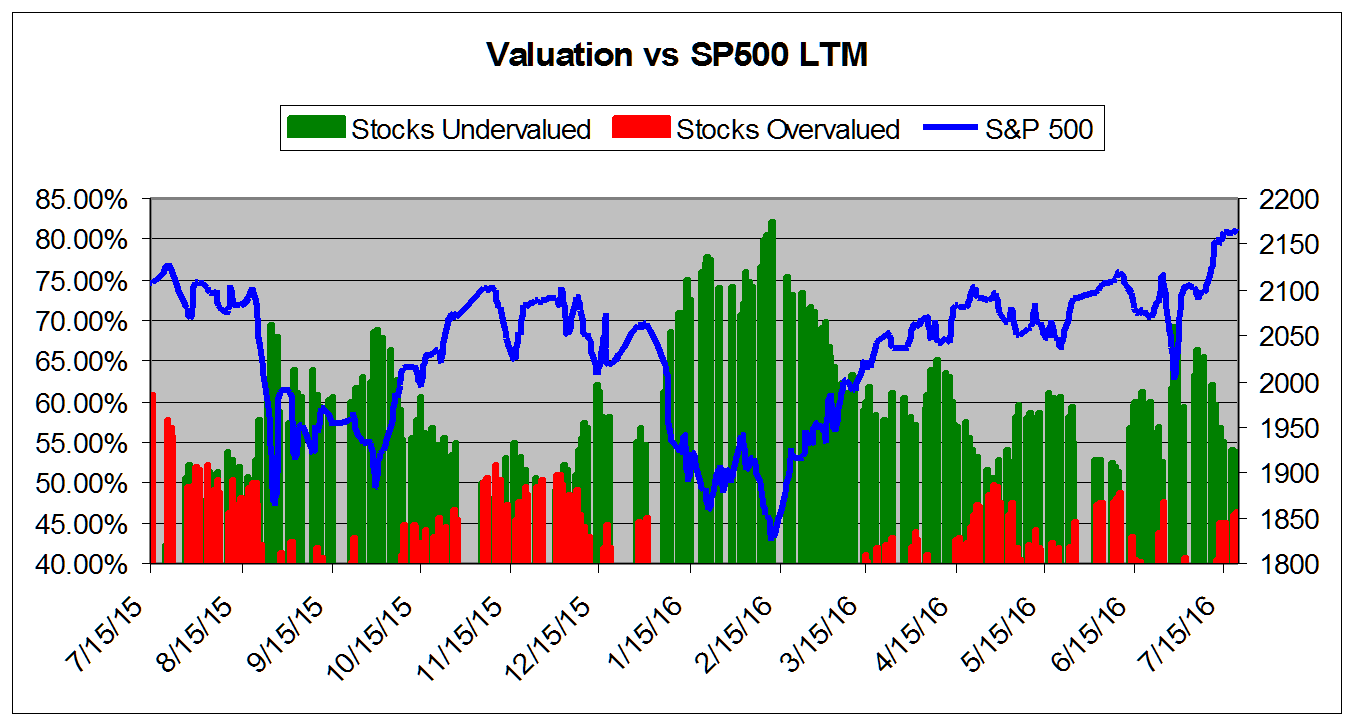
The chart below tracks the valuation metrics from July 2015. It shows levels in excess of 40%.
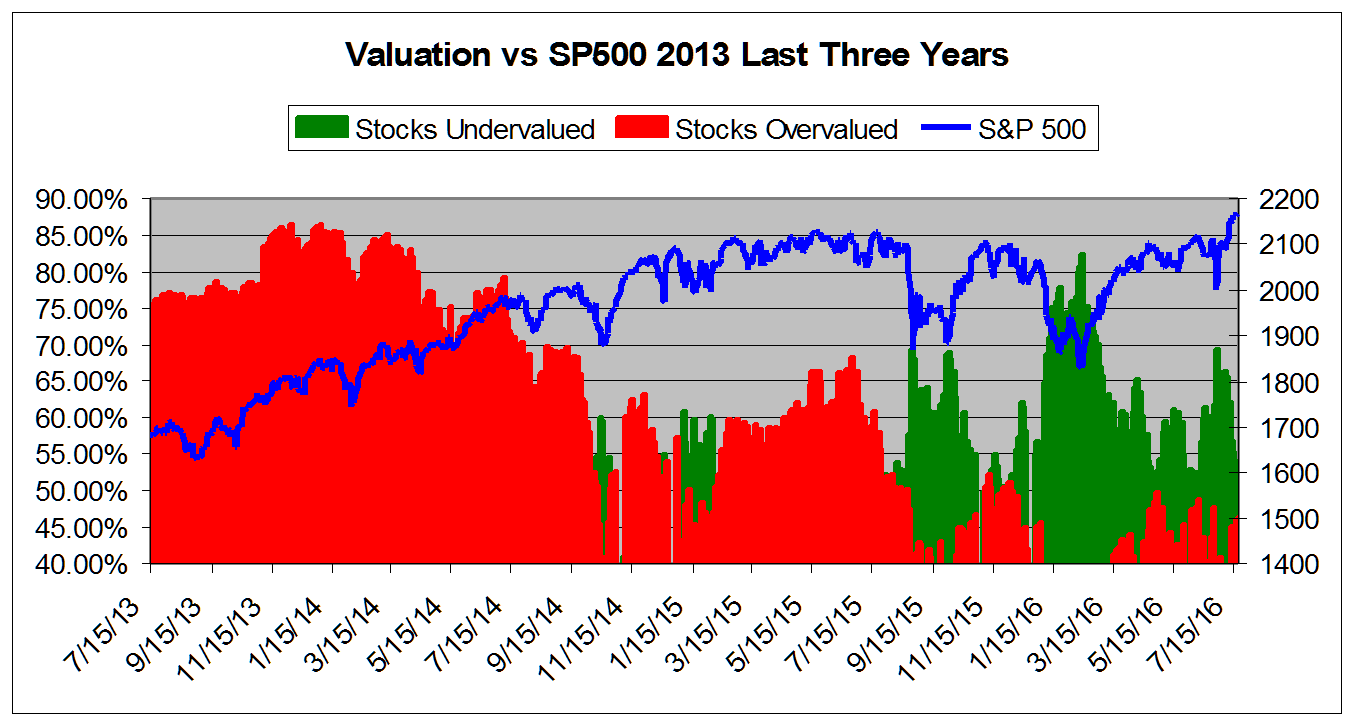
This chart shows overall universe over valuation in excess of 40% vs the S&P 500 from July 2013
This chart shows overall universe under and over valuation in excess of 40% vs the S&P 500 from March 2007*
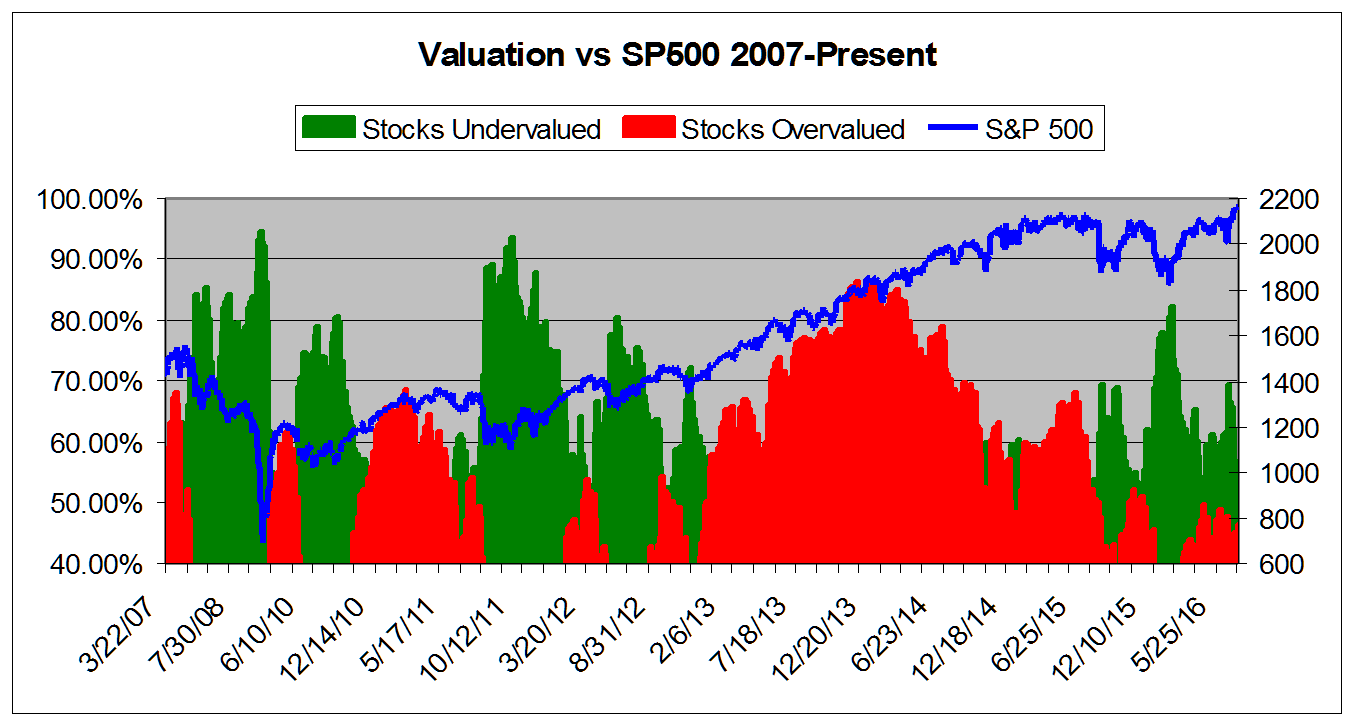
*NOTE: Time Scale Compressed Prior to 2011.
ValuEngineCapital Money Management Services
We are pleased to announce that ValuEngine Capital has begun trading for our clients. ValuEngine Capital, a registered investment advisory firm, offers our clients investment-management services based on industry-leading ValuEngine research. ValuEngine Capital melds the cutting-edge financial theory of ValuEngine's award-winning quantitative independent research with the best real-world Wall St. practices. ValuEngine Capital offers refined investment portfolios for investors of all risk-reward profiles.
ValuEngine Capital is offering three investment strategies to clients, the ValuEngine View Strategy, the ValuEngine Market Neutral Strategy, and the ValuEngine Diversified Strategy.
ValuEngine View Strategy: The ValuEngine View Strategy is the product of a sophisticated stock valuation model that was first developed by ValuEngine's academic research team. It utilizes a three factor approach: fundamental variables such as a company's trailing 12-month Earnings-Per-Share (EPS), the analyst consensus estimate of the company's future 12-month EPS, and the 30-year Treasury yield are all used to create a more accurate reflection of a company's fair value. A total of eleven additional firm specific variables are also used. The ValuEngine View portfolio is constructed by integrating both our Aggressive Growth—based on the Valuation Model--and Diversified Growth—based on the Forecast Model-- Portfolio Strategies. The ValuEngine View Strategy is constructed by integrating this model along with some basic rules for market capitalization and industry diversification. The portfolio has 15 stocks and is rebalanced once each month.
Professional Portfolio Management Services
ValuEngine Market Neutral Strategy: The ValuEngine Market Neutral Strategy is the product of ValuEngine's Forecast Model. This model was developed by a team of PhD's and is based on the cutting edge economic theories of Wall Street professionals and Ivy League academics. We carefully examine dozens of fundamental and technical factors for over 8,000 individual stocks, synthesize the data, and then come up with a sector-diverse list of our best and worst forecast 1-month return stocks. Short and long-term historic factors in the VE Forecast model's calculation include past-valuation levels of the stock and its recent price-momentum factor relative to other stocks. The ValuEngine Market Neutral Strategy utilizes Forecast Model outputs along with market capitalization, price, and sector diversification rules to construct a monthly portfolio made up of 16 stocks for both the long and short sides.
Strategies To Suit All Investor Types
The ValuEngine Diversified Strategy: The ValuEngine Diversified Strategy invests in a variety of asset classes in order to provide investors with stable returns and a high- dividend yield coupled with significantly lower risk than single-asset products. The ValuEngine Diversified Strategy may include ETFs focused on commodities, stock indices, REITS, bonds, emerging markets, and other suitable products. By reaping the benefits of diversification, the ValuEngine Diversified Strategy seeks to remain resilient during times of market volatility. The ValuEngine Diversified Strategy is designed for investors seeking management for their IRA and other retirement funds as well as those whose risk-profile is not suitable for our other strategies.
For more information, please contact us by email at info@ValuEngineCapital.com or by phone at (407) 308-5686.
ValuEngine.com is an independent research provider, producing buy/hold/sell recommendations, target price, and valuations on over 7,000 US and Canadian equities every trading day.
Visit www.ValuEngine.com for more information

If you no longer wish to receive this free newsletter, CLICK HERE to unsubscribe
|