| |
Home |
About Us & VE Models |
Products & Sign Up |
My Account
|
|||
| ||||
 |
||||||||||||||||||||||||||||||||||||||||||||||||||||||||||||||||||||||||||||||||||||||||||||||||||||||||||||||||||||||||||||||||||||||||||||||||||||||||||||||||||||||||||||||||||||||||||||||||||||||||||||||||||||||||||||||||||||||||||||||||||||||||||||||||||||||||||||||||||||||||||||||||||||||||||||||||||||||||||||||||||||||||||||||||||||||||||||||||||||||||||||||||||||||||||||||||||||||||||||||||||||||||||||||||||||||||||||||||||
Top-Five Retail/Wholesale Stocks--Long-Term Forecast Returns
Top-Five Retail/Wholesale Stocks--Composite Score
Top-Five Retail/Wholesale Stocks--Most Overvalued
*NOTE: Despite its high rating by our models in some areas, HerbaLife (HLF) is a problematic company for a variety of reasons. We have been avoiding this stock in our newsletter portfolios. Find out what Wall Street Investment and Media Professionals already know,
What's Hot--U.S. Oil Prices Continue PlungeMarkets are facing unrest over oil, specifically cheap oil. As of yesterday, the price of a barrel of Nymex crude is now below $60. At that price, oil is down more than 40% for the year. This should be good news since cheap energy helps consumers make ends meet for driving, heating, and a host of other activities. In addition, the dollar has been getting stronger, which should also be good news for US-based consumers. However, markets don't like this news, and the declines in oil contributed to a bad day on Wall St. Cheap energy threatens the recent boom in the US and elsewhere as shale gas and oil becomes less attractive and more uneconomical for recovery. Producers across the globe--OPEC-- are attempting to drive competition out, and thus they are keeping the taps turned on "high." We've seen some real changes in our valuations for Oils/Energy. Currently, we find that the sector is undervalued by 226.63% and it leads our sectors in terms of undervaluation by a large margin. The next most undervalued sector, Basic Materials, is only calculated to be undervalued by 14.06%. As a comparison, undervaluation for the energy sector peaked at 15.92% during the brief market pull back in October of this year. In fact, for much of 2014, the sector was calculated to be overvalued anywhere between 15-20%. Cheaper energy and a strong dollar may undermine much of the economic growth we have seen in places like Texas, Oklahoma, North Dakota, Pennsylvania, and Ohio. This causes caution rather than confidence. But, at least in the short-term, it should be a boon for drivers at the pump, residents heating their homes this Winter, etc. Again, investors are cautioned to avoid ideologically-based arguments and investment "gurus" when it comes to their money. Just because someone agrees with your politics does not mean they provide sound advice or objective financial research. That's a quick way to lose capital. Florida, for obvious reasons one of the most promising states for Solar power-- and one of the states most jeopardized by sea-level increases due to climate change--just caved to the demands of the giant power companies in the state by eliminating solar energy rebate programs for consumers AND cutting energy-efficiency goals by 90%. This comes on the heels of similar policy moves in Ohio and Arizona. We would expect a big shift for ratings and valuations of energy companies as our systems re-evaluate the sector in light of large declines in share prices as well as changes in valuation figures. We caution clients to keep in mind that the models cannot really take into account the overall price of oil, they are working off past market behavior and earnings estimates. A company with prior high and future predicted high earnings which has declined in significantly in price will appear more appealing from a valuation perspective.
Want To Know More About Our ValuEngine View Newsletter? We still find a positive economic environment for equities within the United States. As we noted a few weeks ago-- when the market was in a sell off mode, most of the doom and gloom seemed to be emanating from political and media sources looking to capitalize on the slight wobble for electoral purposes. Now, it is worthwhile to note that many of those same "analysts" claim the ongoing rebound is due to the US election results. But we believe that we are seeing not the short-term noise of a mid-term election, but rather the continuation of favorable long-term economic trends within the US that are --finally--being bolstered by an improved employment situation. We hope that nothing from a new GOP-dominated Congress--such as a return to harsh austerity policies favored by the American right wing--will negatively impact the overall upward trajectory of the US economy. We remind investors once more than mixing politics and investing is a very bad idea. Relying on blatantly political sources for economic analysis and advice is a quick path to a poorly performing portfolio. Whenever you hear an analyst, pundit, or other talking head of any ideological predilection attribute market moves to election results--or the daily ebb and flow of life in Washington DC, it's time to hold on to that wallet/purse. Consider the market since January 2009--DOW up 105%, SP500 up 129%, NASDAQ up 196%--Anyone who listened to the "BUY GOLD BUY GUNS BUY SEEDS" crowd after the election of 2008 missed out on an epic rally. In any case, with favorable markets we find that once more our top-performing newsletter portfolio, the ValuEngine View, has bounced back wonderfully and has returned to its winning ways. Looking for a monthly portfolio of stock picks which are objective and based on cutting-edge academic theory and Wall St.practice? Then subscribe to The ValuEngine View Newsletter.The ValuEngine View Portfolio is based on our highly-refined and tested ValuEngine Portfolio Strategies along with our proprietary quant-based composite scoring system. The ValuEngine View Newsletter is the product of sophisticated stock valuation and forecast models first developed by Yale Professor of Finance Zhiwu Chen. The ValuEngine View Newsletter is the product of a sophisticated stock valuation model that was first developed by ValuEngine's academic research team. It utilizes a three factor approach: fundamental variables such as a company's trailing 12-month Earnings-Per-Share (EPS), the analyst consensus estimate of the company's future 12-month EPS, and the 30-year Treasury yield are all used to create a more accurate reflection of a company's fair value. A total of eleven additional firm specific variables are also used. In addition, the portoflio uses top picks from our Forecast Model. In essence, the portfolio is constructed with the best picks from our main propiretary models Each month you will receive an electronic copy of our newsletter highlighting 15 potential long positions along with five alternate picks. Our investment strategies focus on dozens of fundamental and technical factors for over 8000 individual stocks, synthesize the data, and then come up with a portfolio. Each newsletter portfolio focuses on maximum potential returns so there are no diversity requirements. Each portfolio pick includes critical ValuEngine valuation and forecast data. These 20 total picks represent the most up-to-date equity assessments of our proprietary models. Please click HERE to subscribe. You may download a sample copy HERE. After your subscription is approved, you will immediately receive access to download the current issue of newsletter as well as the previous issues, which are all available as PDF files. Each month when the latest issue of the newsletter is released, we will send you an email, informing you to download it from the site. The newsletter is released near the middle of each month.
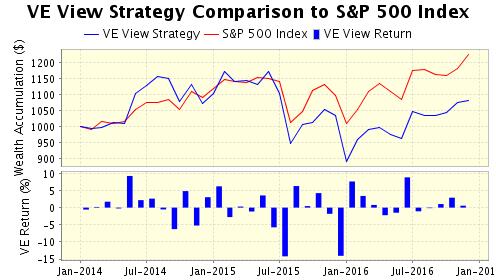
The ValuEngine View Newsletter is derived from the ValuEngine Aggressive and Diversified Growth Benchmark CLICK HERE to Subscribe to the ValuEngine View The ValuEngine View Newsletter portfolio has 15 primary stock picks and five alternates and is re-balanced once each month. The ValuEngine View Newsletter is published near the middle of each calendar month. An equal amount of capital is allocated to each stock. The monthly returns are calculated from the closing prices on date of publication. The performance calculation does not include any transaction costs. If you no longer wish to receive this free newsletter, CLICK HERE to unsubscribe |
|
|||||||||||||||||||||||||||||||||||||||||||||||||||||||||||||||||||||||||||||||||||||||||||||||||||||||||||||||||||||||||||||||||||||||||||||||||||||||||||||||||||||||||||||||||||||||||||||||||||||||||||||||||||||||||||||||||||||||||||||||||||||||||||||||||||||||||||||||||||||||||||||||||||||||||||||||||||||||||||||||||||||||||||||||||||||||||||||||||||||||||||||||||||||||||||||||||||||||||||||||||||||||||||||||||||||||||||||||||
 |
||||||||||||||||||||||||||||||||||||||||||||||||||||||||||||||||||||||||||||||||||||||||||||||||||||||||||||||||||||||||||||||||||||||||||||||||||||||||||||||||||||||||||||||||||||||||||||||||||||||||||||||||||||||||||||||||||||||||||||||||||||||||||||||||||||||||||||||||||||||||||||||||||||||||||||||||||||||||||||||||||||||||||||||||||||||||||||||||||||||||||||||||||||||||||||||||||||||||||||||||||||||||||||||||||||||||||||||||||

Testimonials | Press & News | B2B Partners | Privacy & Security Statement | Disclaimer
Analyst research and earnings information provided by IBES. Financial data provided by CapitalIQ.
Copyright 1998-2010 ValuEngine Inc. All Rights Reserved.