August 2, 2013
The ValuEngine
Weekly is an Investor Education newsletter focused on the
quantitative approach to investing and the tools available
from ValuEngine.com. In today's fast-moving and globalized financial markets, it is easy to get overloaded with information.
The winners will adopt an objective, scientific,
independent and unemotional approach to investing. If you
are not yet a member of ValuEngine's stock analysis service,
sign up now for a free trial at www.valuengine.com!
If the tables, charts, or other content in this email version of the newsletter do not display properly, please download the HTML version from
ValuEngine.com HERE or the PDF version from SCRIBD.com HERE
If you no longer wish to receive this free newsletter,
CLICK HERE to unsubscribe |
VALUATION WARNING: Our models find that overvaluation is at levels typically seen when market pullbacks occur. Overvalued stocks now make up 77% of our stocks assigned a valuation and 46% of those equities are calculated to be overvalued by 20% or more. 15 of 16 sectors are calculated to be overvalued--13 of them by double digits.
ValuEngine Index Overview
|
|
|
|
|
|
DJIA |
15557.14 |
15628 |
70.86 |
0.46% |
19.26% |
NASDAQ |
3604.29 |
3675.74 |
71.45 |
1.98% |
21.73% |
RUSSELL 2000 |
1047.13 |
1059.88 |
12.75 |
1.22% |
24.79% |
S&P 500 |
1690.32 |
1706.87 |
16.55 |
0.98% |
19.68% |
ValuEngine Market Overview
Summary of VE Stock Universe |
Stocks Undervalued |
22.95% |
Stocks Overvalued |
77.05% |
Stocks Undervalued by 20% |
9.73% |
Stocks Overvalued by 20% |
46.31% |
ValuEngine Sector Overview
|
|
|
|
|
|
|
Auto-Tires-Trucks |
0.96% |
1.05% |
41.16% |
26.99% overvalued |
46.70% |
18.89 |
Retail-Wholesale |
1.31% |
1.43% |
36.16% |
25.75% overvalued |
39.46% |
23.22 |
Consumer Discretionary |
1.15% |
1.23% |
30.70% |
25.55% overvalued |
30.99% |
24.70 |
Consumer Staples |
0.84% |
0.92% |
18.08% |
22.85% overvalued |
22.19% |
21.53 |
Computer and Technology |
1.38% |
1.54% |
29.03% |
22.77% overvalued |
25.97% |
30.48 |
Aerospace |
0.84% |
0.87% |
27.89% |
22.20% overvalued |
32.00% |
18.20 |
Finance |
0.62% |
0.68% |
26.92% |
20.63% overvalued |
18.69% |
17.94 |
Medical |
0.90% |
1.06% |
202.57% |
20.29% overvalued |
23.41% |
25.81 |
Industrial Products |
1.28% |
2.72% |
37.04% |
18.52% overvalued |
29.35% |
20.96 |
Business Services |
1.14% |
1.23% |
76.40% |
18.10% overvalued |
25.72% |
24.25 |
Transportation |
1.60% |
1.66% |
27.12% |
15.66% overvalued |
23.25% |
21.95 |
Construction |
1.03% |
1.12% |
33.19% |
13.78% overvalued |
36.84% |
25.54 |
Multi-Sector Conglomerates |
1.35% |
1.40% |
8.62% |
12.00% overvalued |
17.16% |
17.24 |
Utilities |
0.65% |
0.78% |
18.48% |
10.70% overvalued |
11.20% |
20.64 |
Oils-Energy |
0.52% |
0.65% |
26.43% |
5.79% overvalued |
7.50% |
27.82 |
Basic Materials |
0.03% |
0.13% |
2.42% |
5.88% undervalued |
-21.53% |
20.04 |
ValuEngine Newsletters Latest Results
VE Newsletter |
Current Results |
S&P 500 |
Last Month Total |
S&P 500 |
Since Inception |
S&P 500 |
|
1.11 |
1.45 |
3.56 |
2.62 |
91.13 |
84.17 |
|
0.89 |
0.67 |
8.47 |
6.76 |
8.47 |
6.76 |
|
-2.80 |
0.86 |
13.82 |
3.9 |
39.26 |
22.03 |
|
2.58 |
1.83 |
4.51 |
1.48 |
75.27 |
48.02 |
ValuEngine's Newsletters Beat the Market
With our Investment Newsletters, Subscribers Harness the Power of all of ValuEngine.com's Extensively Tracked and Tested Portfolio Strategies in an Easy to Follow Format.
Let ValuEngine Optimize your Portfolio and Provide Rational Advice for Smarter Investing
Click HERE to Check Out ValuEngine's Investment Newsletters
Free Download for Readers
As a bonus to our Free Weekly Newsletter subscribers, we are offering a FREE DOWNLOAD of one of our Detailed Stock Valuation Reports--this report is normally $25.00
This week's free download is our report on Bank of America (BAC). Bank of Americais one of the world's leading financial services companies. Bank of America provides individuals, small businesses and commercial, corporate and institutional clients across the United States and around the world new and better ways to manage their financial lives. The company enables customers to do their banking and investing whenever, wherever and however they choose.
ValuEngine continues its HOLD recommendation on Bank of America for 2013-08-01. Based on the information we have gathered and our resulting research, we feel that Bank of America has the probability to ROUGHLY MATCH average market performance for the next year. The company exhibits ATTRACTIVE Company Size but UNATTRACTIVE Volatility.
Read our Complete Detailed Valuation Report on Bank of America HERE.
(LINK IS WORKING/NEW LINK SYSTEM DIRECT DOWNLOAD)
Sector Talk--Computers and Technology
Below, we present the latest data on Computers and Technology stocks from our Institutional software package (VEI). Top five lists are provided for each category. We applied some basic liquidity criteria--share price greater than $3 and average daily volume in excess of 100k shares.
Please Click Here to Download a FREE Demo of ValuEngine's Professional VEI Software Package.
Top-Five Computers and Technology Stocks--Short-Term Forecast Returns
Ticker |
Name |
Mkt Price |
Valuation(%) |
Last 12-M Retn(%) |
BBRY |
BLACKBERRY LTD |
8.76 |
27.93 |
23.09 |
IQNT |
INTELIQUENT INC |
8.11 |
-14.15 |
-39.79 |
AMD |
ADV MICRO DEV |
3.81 |
-30.61 |
-5.93 |
TQNT |
TRIQUINT SEMICO |
8.01 |
-20.07 |
43.04 |
TNAV |
TELENAV INC |
6.13 |
294.76 |
8.11 |
Top-Five Computers and Technology Stocks--Long-Term Forecast Returns
Ticker |
Name |
Mkt Price |
Valuation(%) |
Last 12-M Retn(%) |
BBRY |
BLACKBERRY LTD |
8.76 |
27.93 |
23.09 |
IQNT |
INTELIQUENT INC |
8.11 |
-14.15 |
-39.79 |
AMD |
ADV MICRO DEV |
3.81 |
-30.61 |
-5.93 |
TQNT |
TRIQUINT SEMICO |
8.01 |
-20.07 |
43.04 |
TNAV |
TELENAV INC |
6.13 |
294.76 |
8.11 |
Top-Five Computers and Technology Stocks--Composite Score
Ticker |
Name |
Mkt Price |
Valuation(%) |
Last 12-M Retn(%) |
HPQ |
HEWLETT PACKARD |
26.23 |
4.02 |
48.53 |
ROVI |
ROVI CORP |
19.43 |
-36.13 |
44.89 |
CYOU |
CHANGYOU.COM |
33.17 |
8.11 |
66.1 |
TSM |
TAIWAN SEMI-ADR |
17.25 |
-0.27 |
24.28 |
DELL |
DELL INC |
12.95 |
-0.12 |
9.88 |
Top-Five Computers and Technology Stocks--Most Overvalued
Ticker |
Name |
Mkt Price |
Valuation(%) |
Last 12-M Retn(%) |
CRAY |
CRAY INC |
28.2 |
300 |
148.02 |
NIHD |
NII HLDGS-CL B |
6.71 |
300 |
-5.23 |
TNAV |
TELENAV INC |
6.13 |
294.76 |
8.11 |
N |
NETSUITE INC |
97.77 |
248.43 |
83.02 |
CKSW |
CLICKSOFTWARE |
7.3 |
226.64 |
-2.28 |
Find out what Wall Street Investment and Media Professionals already know,
ValuEngine offers sophisticated stock valuation and forecast research as well as a variety of portfolio screening and creation tools.
What's Hot--
Market Valuation Reaches High Levels, Valuation Warning Continues
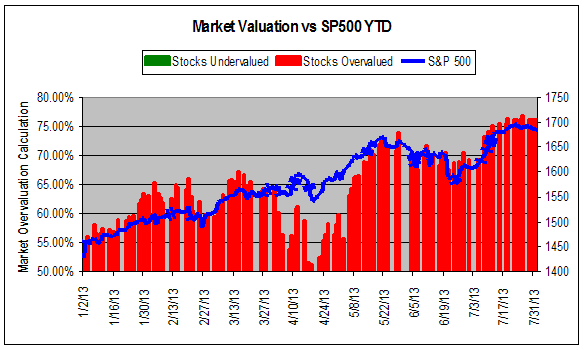
The ValuEngine Valuation Model tracks more than 7000 US equities, ADRs, and foreign stock which trade on US exchanges. When EPS estimates are available for a given equity, our model calculates a level of mispricing or valuation percentage for that equity based on earnings estimates and what the stock should be worth if the market were totally rational and efficient--an academic exercise to be sure, but one which allows for useful comparisons between equities, sectors, and industries. Using our Valuation Model, we can currently assign a VE valuation calculation to more than 3600 stocks.
We combine all of the equities with a valuation calculation to track market valuation figures and use them as a metric for making calls about the overall state of the market. Whenever we see levels in overvaluation levels in excess of @ 65% for the overall universe and/or 27% for the overvalued by 20% or more categories, we issue a valuation warning. We issued our latest valuation warning on May 8th. At that time, the S&P was at 1625.
As of yesterday's close, we now calculate that 77% of stocks are overvalued and 46% of stocks are overvalued by 20% or more. These levels represent some of the highest we have ever tracked. These sorts of market overvaluation and overvalued by 20% or more figures exceed levels which have been correlated with market pull backs in the past. Two factors can lower them, a market pullback, or a rise in earnings and EPS estimates. The markets have been on quite a tear to the upside all Summer, so unless the market embarks on a downward leg and/or companies begin bigger earnings and analysts adjust their EPS estimates, we expect to see these figures remain high.
Investors are reminded to remain cautious against a move to the downside.
Keep a close eye on the market and consider booking some profits.
Subscribers Get FULL ACCESS to our Market and Sector Overviews
The chart below tracks the valuation metrics from January 2013 until today.
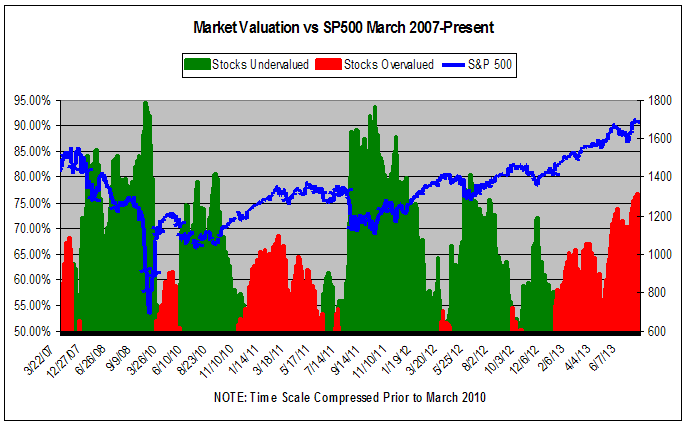
This chart shows overall universe under and over valuation in excess of 50% vs the S&P 500 from June 2012 to the present.

This chart shows overall universe under and over valuation in excess of 50% vs the S&P 500 from March 2007 to the present.
In addition to the overall valuation metrics, we see that on a sector basis 15 of 16 sectors are calculated to be overvalued. In the past, our Chief Market Strategist Richard Suttmeier has used the sector valuation figures to buttress his macro market calls. This is another indicator that investors should consider implementing additional risk management tools and/or booking some profits.
Suttmeier Says
--Commentary and Analysis from Chief Market Strategist Richard Suttmeier
If you have any comments or questions, send them to Rsuttmeier@Gmail.com 
Treasury Yields
10-Year--(2.714) Daily, weekly and semiannual value levels are 2.726, 2.788 and 3.227 with monthly, annual, monthly, annual and semiannual risky levels at 2.601, 2.476, 2.284, 1.981 and 1.719.
Commodities and Forex
Comex Gold –($1310.8) Monthly and weekly value levels are $1229.7 and $1227.7 with daily, annual, quarterly and annual risky levels at $1318.0, $1599.9, $1603.0 and $1852.1.
Nymex Crude Oil – ($107.74) Daily, monthly and quarterly value levels are $104.72, $104.48 and $91.75 with weekly, semiannual and annual risky levels at $110.87, $109.84 and $115.23.
The Euro – (1.3204) Semiannual and quarterly value levels are 1.2477 and 1.1545 with weekly and annual pivots at 1.3259 and 1.3257, and daily, monthly and annual risky levels at 1.3306, 1.3313 and 1.4295.
Major Indices
Daily Dow: (15,628) Daily, weekly, quarterly and annual value levels are 15,571, 15,393, 14,288 and
12,696 with the August 1 all time high at 15,650.69, and monthly and semiannual risky levels at 16,188
and 16,490.
S&P 500 – (1706.9) Daily, weekly, quarterly and annual value levels are 1689.1, 1670.7, 1525.6 and
1348.3 with the August 1 all time high at 1707.85, and monthly and semiannual risky levels at 1742.5
and 1743.5.
NASDAQ – (3676) Daily, weekly, quarterly and annual value levels are 3638, 3554, 3284 and 2806
with a monthly pivot at 3663, the August 1 multi-year high at 3678.50, and semiannual risky level at
3759.
NASDAQ 100 (NDX) – (3126) Daily, monthly, weekly, quarterly and annual value levels are 3102,
3080, 3010, 2983 and 2463 with the August 1 multi-year high at 3128.67, and semiannual risky level at
3304.
Dow Transports – (6670) Daily, weekly, annual and quarterly value levels are 6421, 6420, 6346, 5925,
5469 and 5348 with the August 1 all time high at 6686.86, and monthly and semiannual risky levels at
7087 and 7104.
Russell 2000 – (1059.88) Daily, weekly, quarterly and annual value levels are 1046.13, 1037.98,
863.05, 860.25 and 809.54 with the August 1 all time high at 1060.96, and monthly and semiannual
risky levels at 1092.24 and 1089.42.
The SOX – (486.60) Weekly, daily, quarterly and annual value levels are 479.02, 471.58, 468.27,
404.59 and 338.03 with monthly and semiannual risky levels at 513.89 and 533.56.
Dow Utilities: (509.06) Daily and weekly value levels are 504.39 and 500.04 with quarterly,
semiannual, monthly and annual risky levels at 510.38, 523.33, 530.15 and 540.37.
Stock of the Day
One of the more popular features of Richard Suttmeier's Morning Briefing for investors is his stock of the day. In every issue, Suttmeier highlights one stock and provides VE data as well as his own proprietary technical data.
Here is today's stock of the day from Richard Suttmeier's Morning Briefing Newsletter.
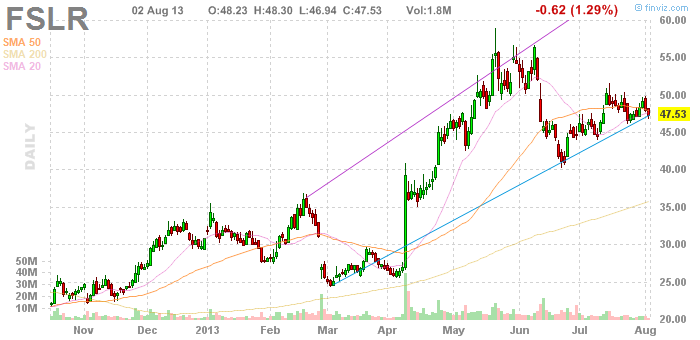
First Solar (FSLR) – ($48.15) First Solar manufactures solar modules with an advanced thin film semiconductor process that significantly lowers solar electricity costs. By enabling clean renewable electricity at affordable prices, First Solar provides an economic alternative to peak conventional electricity and the related fossil fuel dependence, greenhouse gas emissions and peak time grid constraints.
Analysis – First Solar has a Hold rating according to ValuEngine with fair value at $72.50, which makes the stock 32.1% undervalued, The ValuEngine one-year price target is $50.83. The daily chart for First Solar shows declining momentum with the stock between its 21-day and 50-day simple moving averages at $47.58 and $48.14, and above the 200-day simple moving average at $35.75. My semiannual value level is $39.45 with a monthly risky level at $52.13.
NEW APPEARANCE SCHEDULED
New York Chapter Meeting of the Market Technicians Association
August 14th
featuring Richard Suttmeier and Stephen Suttmeier, CFA, CMT
Mixing Fundamental Data & Technicals in Market-Timing
Richard & Stephen Suttmeier will be giving a joint presentation to MTA members and guests
Wednesday, August 14, 2001 at 5:00 PM
The New York Society of Security Analysts (NYSSA)
1540 Broadway, #1010
New York, NY.
The entrance is on West 45th Street between Broadway and 6th Ave.
Presentation at 5:30 PM.
Richard Suttmeier, Chief Market Strategist at ValuEngine.com & Contributor to TheStreet.com
Richard Suttmeier has been a professional in the US Capital Markets since 1972 transferring his engineering skills to the trading and investment world. He earned a Bachelor of Industrial Engineering degree from Georgia Institute of Technology in 1966, and a Master of Science, Operations Research, Systems Analysis degree from Brooklyn Polytechnic University in 1970. Over the years Richard appeared many times in the financial media, on networks such as CNBC, CNN, CNNfn, New York 1, Bloomberg TV and radio, Fox Business, Business News Network in Canada, Wall Street Week with Fortune, Yahoo Finance Breakout, and the Bill Mazer Radio Show. In 2002, he anchored his own show on Yahoo Finance Vision called, "Traders' Club with Richard Suttmeier." Richard has been frequently quoted in USA Today, The NY Times, Wall Street Journal, Reuters, and The Dow Jones Newswires. Richard has made numerous speaking appearances in recent years to groups such as the Market Technicians Associations, the American Association of Individual Investors, Wells Fargo Advisors, the Executive Forum at the National Arts Club, and the Investors Roundtable of Wilmington NC.
Stephen Suttmeier, CFA, CMT
Stephen W. Suttmeier, CFA, CMT, is the Chief Equity Technical Strategist at BofA Merrill Lynch Global Research. Stephen has 19 years of experience in financial services. Prior to joining the firm in March 2007, Stephen was a small-cap equity research analyst at Capital Growth Financial and Joseph Gunnar & Co. Before that, he was senior technical analyst at Informa Global Markets, where he covered the fixed income, foreign exchange and commodity markets. Stephen holds the Chartered Financial Analyst (CFA) and Chartered Market Technician (CMT) designations and is a member of the American Association of Professional Technical Analysts (AAPTA), CFA Institute (CFAI), and the Market Technicians Association (MTA). He is Co-Chair for the New York Region MTA Chapter and the current Chairman for the CMT Board of Governors (BoG). The CMT BoG is responsible for the execution of the vision and strategic initiatives of the CMT Program. Stephen is also a grader for the CMT level III exam and was a CMT test question writer and subject matter expert (SME) from 2007-2012. Stephen earned his MBA from Fordham University's Graduate School of Business with a dual concentration in finance and accounting. He completed his undergraduate education at Fairfield University, where he received a bachelor degree with a double major in biology and English. He holds the Series 4, 7, 24, 63 and 87 licenses from the NASD.
Find Out More and Register HERE
Now YOU can take advantage of the same market and trading expertise as the financial media with Richard Suttmeier's ValuTrader Model Portfolio
The ValuTrader Portfolio Newsletter is based on ValuEngine Chief Market Strategist Richard Suttmeier's proprietary market analytics. Suttmeier combines his technical analysis expertise with ValuEngine's proprietary valuation, forecast, and ratings data for more than 4000 equities trading on US markets to come up with a 20 stock portfolio tailored to current market conditions. With ValuTrader, subscribers access Suttmeier's "Buy and Trade" strategy with a portfolio designed to function well in both up and down markets.
Every edition of Richard Suttmeier's ValuTrader model portfolio includes technical risk, pivot, and value levels, as well as critical ValuEngine data points--ratings, valuation, and forecast--for the current portfolio. Whenever Suttmeier buys a new stock or sells a current holding, subscribers receive an email alert so that they can take advantage of Suttmeier's proven market-timing expertise. The portfolio may include long as well as short positions according to Suttmeier's read of the markets.
With Richard Suttmeier's Morning Briefing, you get daily analysis of US Treasury Yields, Gold, Crude Oil, and Currency Exchange Rates--Dollar, Yen, Pound, and Euro--as well as key technical indicators for the major equity averages. |
|
 |

If you no longer wish to receive this free newsletter, CLICK HERE to unsubscribe
|


