Every ValuEngine model, ratings system, benchmark portfolio strategy, and newsletter portfolio strategy has been extensively researched and back-tested with historical data from the U.S. equities markets. Where applicable, our models have also been tracked by outside auditors and found to be predictive. Over the long term, the performance of our strategies and newsletters exceeds that of many well-known stock-picking styles. This page illustrates the superior performance of our benchmark portfolio strategies and our proprietary "Engine Rating" system.
 (5-engine Rating) (5-engine Rating)
Engine Ratings: ValuEngine's proprietary Engine Rating system provides an overall assessment of a stock's attractiveness.
ValuEngine's stock recommendations are based on the proprietary ValuEngine
one-year forecast return (1YFR) model output for each individual equity. A stock is rated Strong Buy, Buy, Hold, Sell, Strong Sell based on the Forecast One Year Return. Our 5-Engine scale provides an easy to understand and actionable format.
The breakdown for each rating is as follows:
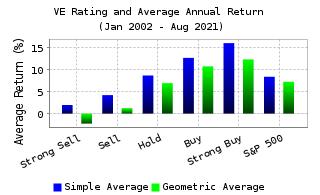
- Strong Buy: More than +12% 1YFR
- Buy: Between +5% and +12% 1YFR
- Hold: Between -5% and +5% 1YFR
- Sell: Between -12% and -5% 1YFR
- Strong Sell: Less than -12% 1YFR
There is an additional buffer for stock upgrades or stock downgrades to eliminate stocks moving back and forth quickly between ratings.
The tables above and below demonstrate how well the
Engine Rating system and various ValuEngine benchmark portfolio strategies perform.
This indicates that the rating system is predictive and the portfolio strategies beat their benchmark indices.
Click HERE for more Engine Rating back-test results.
|
In addition to the performance charts you see here, you can also examine our live-tracked performance numbers, current ValuEngine Benchmark Portfolio Strategy holdings, and additional information on our models and strategies.
You may also click HERE to download
VE Portfolio Strategy Historical Studies.
Overview
The ValuEngine Research Findings page explores the following research topics:
The Model Test Methodology
ValuEngine currently conducts back tests and performance tracking on US stocks for the period January, 2000 to the present. To maintain the integrity of our research and development process, all of our back tests are conducted under rigorous guidelines designed to eliminate the most common problems that arise when attempting to vet a strategy via the use of historical market data. ValuEngine's back tests eliminate any and all survivorship, forward-looking, and data-snooping biases. This means that while the tests are conducted in the present, the buy/sell decisions are based solely on data that was contemporary to the time period as well as a historically accurate stock universe.
This "out-of-sample" decision rule applies to every investment strategy and/or model we test. For example, when we test our book/market ratio strategy for March, 1988, only the book/market ratio of each stock in March 1988 is used to determine which stocks should be bought or sold during that month. Similarly, strategies based on the return forecasting models for March 1990 used only the data available up to that month to estimate the forecasting parameters applied to predict the post-March 1990 returns.
In other words, no information that later became known is utilized by our models. This rigorous test methodology allows greater confidence in our strategies and helps to insure that they perform in a variety of market conditions.
Results for the VE Forecasting Models
To demonstrate the performance of our forecasting
models, we ran a separate set of back-tests using the same stock universe
employed to test the above investment strategies. Specifically, for each
past month in the study, we first estimated the forecasting coefficients
for every model using only data available up to that month. In step 2,
we made forecasts for each stock's one-month-forward return.
In step 3, we divided all the stocks of that month into 10 decile groups (i.e., 10 groups of equal number).
With an equal dollar amount invested
in every stock included in a given decile group, we obtained 10 equally-weighted
decile portfolios for the month going forward. In step 4, we computed
the actual returns for each of the decile portfolios over the immediate
month. Then, we repeated these steps for all the months in the study.
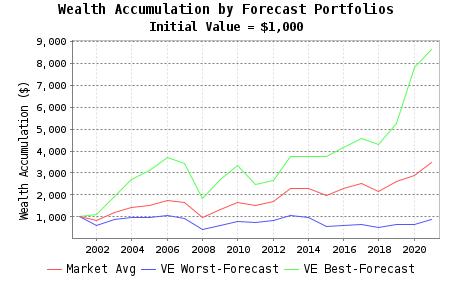
The chart below shows the average annualized
returns for the best and the worst forecasted-return portfolios.
It clearly shows that over the long term and for most years our forecasting model-- like our engine rating system, is predictive and performs remarkably well.
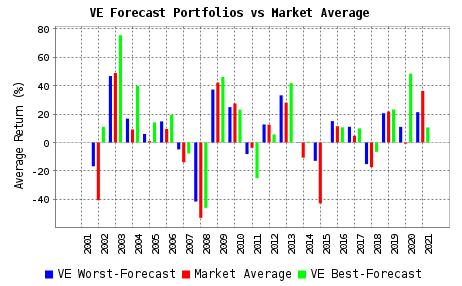
The following chart also demonstrates the effectiveness of our forecast model. As you can see, the two different portfolios perform as predicted with the top-ranked portfolio providing major increases in performance when compared to the bottom-ranked portfolio and the overall stock universe.
|

 We Cover Both USA & Canadian
Equities Now!
We Cover Both USA & Canadian
Equities Now!