February 7, 2014
The ValuEngine
Weekly is an Investor Education newsletter focused on the
quantitative approach to investing and the tools available
from ValuEngine.com. In today's fast-moving and globalized financial markets, it is easy to get overloaded with information.
The winners will adopt an objective, scientific,
independent and unemotional approach to investing. If you
are not yet a member of ValuEngine's stock analysis service,
sign up now for a free trial at www.valuengine.com!
If the tables, charts, or other content in this email version of the newsletter do not display properly, please download the HTML version from
ValuEngine.com HERE or the PDF version from SCRIBD.com HERE
If you no longer wish to receive this free newsletter,
CLICK HERE to unsubscribe |
VALUATION WARNING: Our models find that overvaluation is at levels typically seen when market pullbacks occur. Overvalued stocks now make up 77% of our stocks assigned a valuation and 35% of those equities are calculated to be overvalued by 20% or more. ALL sectors are again calculated to be overvalued--eleven by double digits.
ValuEngine Index Overview
|
|
|
|
|
|
DJIA |
15697.69 |
15628.53 |
-69.16 |
-0.44% |
-5.16% |
NASDAQ |
4105.06 |
4057.12 |
-47.94 |
-1.17% |
-1.65% |
RUSSELL 2000 |
1130.10 |
1103.93 |
-26.17 |
-2.32% |
-4.40% |
S&P 500 |
1782.68 |
1773.43 |
-9.25 |
-0.52% |
-3.29% |
ValuEngine Market Overview
Summary of VE Stock Universe |
Stocks Undervalued |
22.98% |
Stocks Overvalued |
77.02% |
Stocks Undervalued by 20% |
6.08% |
Stocks Overvalued by 20% |
35.22% |
ValuEngine Sector Overview
ValuEngine Newsletters Latest Results
VE Newsletter |
Current Results |
S&P 500 |
Last Month Total |
S&P 500 |
Since Inception |
S&P 500 |
|
-10.07 |
-3.93 |
1.73 |
3.64 |
109.34 |
102.06 |
|
-3.93 |
-2.79 |
0.33 |
1.54 |
11.84 |
17.51 |
|
-7.02 |
-5.05 |
8.43 |
1.95 |
45.69 |
33.02 |
|
-7.63 |
-3.82 |
1.17 |
1.83 |
98.93 |
62.81 |
ValuEngine's Newsletters Beat the Market
With our Investment Newsletters, Subscribers Harness the Power of all of ValuEngine.com's Extensively Tracked and Tested Portfolio Strategies in an Easy to Follow Format.
Let ValuEngine Optimize your Portfolio and Provide Rational Advice for Smarter Investing
Click HERE to Check Out ValuEngine's Investment Newsletters
Free Download for Readers
As a bonus to our Free Weekly Newsletter subscribers,
we are offering a FREE DOWNLOAD of one of our Stock Reports
Pulte Corporation (PHM) is a publicly held holding company whose subsidiaries engage in the homebuilding and financial services businesses. The company's significant subsidiaries include Pulte Financial Companies, Inc., Pulte Diversified Companies, Inc., and other subsidiaries which are engaged in the homebuilding business.
ValuEngine continues its SELL recommendation on PULTE GROUP ONC for 2014-02-06. Based on the information we have gathered and our resulting research, we feel that PULTE GROUP ONC has the probability to UNDERPERFORM average market performance for the next year. The company exhibits UNATTRACTIVE Earnings Growth Rate and Momentum.
Read our Detailed Valuation Report, a $25 value, for FREE HERE.
Sector Talk--Basic Materials
Below, we present the latest data on Basic Materials stocks from our Institutional software package (VEI). Top five lists are provided for each category. We applied some basic liquidity criteria--share price greater than $3 and average daily volume in excess of 100k shares.
Please Click Here to Download a FREE Demo of ValuEngine's Professional VEI Software Package.
Top-Five Basic Materials Stocks--Short-Term Forecast Returns
Ticker |
Name |
Mkt Price |
Valuation(%) |
Last 12-M Retn(%) |
EXK |
ENDEAVOUR SILVR |
4.53 |
11.56 |
-34.63 |
HCLP |
HI-CRUSH PTNRS |
36.79 |
N/A |
110.59 |
VRS |
VERSO PAPER CP |
3.08 |
N/A |
199.03 |
AKS |
AK STEEL HLDG |
6.54 |
-22.15 |
56.09 |
SLCA |
US SILICA HOLDI |
26.89 |
N/A |
30.66 |
Top-Five Basic Materials Stocks--Long-Term Forecast Returns
Ticker |
Name |
Mkt Price |
Valuation(%) |
Last 12-M Retn(%) |
EXK |
ENDEAVOUR SILVR |
4.53 |
11.56 |
-34.63 |
HCLP |
HI-CRUSH PTNRS |
36.79 |
N/A |
110.59 |
VRS |
VERSO PAPER CP |
3.08 |
N/A |
199.03 |
AKS |
AK STEEL HLDG |
6.54 |
-22.15 |
56.09 |
SLCA |
US SILICA HOLDI |
26.89 |
N/A |
30.66 |
Top-Five Basic Materials Stocks--Composite Score
Ticker |
Name |
Mkt Price |
Valuation(%) |
Last 12-M Retn(%) |
TX |
TERNIUM SA-ADR |
29.85 |
3.08 |
27.56 |
MEOH |
METHANEX CORP |
59.41 |
6.31 |
71.61 |
KS |
KAPSTONE PAPER |
28 |
1.76 |
128.29 |
AKS |
AK STEEL HLDG |
6.54 |
-22.15 |
56.09 |
RKT |
ROCK-TENN CO |
100.62 |
-0.76 |
23.61 |
Top-Five Basic Materials Stocks--Most Overvalued
Ticker |
Name |
Mkt Price |
Valuation(%) |
Last 12-M Retn(%) |
IPI |
INTREPID POTASH |
15.47 |
198.56 |
-33.66 |
ROC |
ROCKWOOD HLDGS |
69.5 |
104.73 |
27.15 |
WPP |
WAUSAU PAPER CP |
13.73 |
87.2 |
40.97 |
IAG |
IAMGOLD CORP |
3.49 |
69.18 |
-59.89 |
CHMT |
CHEMTURA CORP |
23.93 |
64.92 |
1.83 |
Find out what Wall Street Investment and Media Professionals already know,
ValuEngine offers sophisticated stock valuation and forecast research as well as a variety of portfolio screening and creation tools.
What's Hot--VE Web Log (BLOG) Consolidates Content
We have added a blog to the VE Website. This new section consolidates all of our free content in one easily accessible location. Of special note is the work of our Chief Market Strategist Richard Suttmeier. Suttmeier, a prolific market analyst and commnetator, writes for forbes, thestreet.com, and many other investor websites. Check out our new blog page for one-stop access to all of his work as well as other bulletins and analysis based on ValUEngine's award-winning stock valuation and forecast services.
Check out our new blog page HERE
Suttmeier Says
--Commentary and Analysis from Chief Market Strategist Richard Suttmeier
If you have any comments or questions, send them to Rsuttmeier@Gmail.com 
Treasury Yields
10-Year--(2.702) Weekly and monthly value levels are 2.783 and 3.208 with a quarterly pivot at 2.628 and daily, annual and semiannual risky levels at 2.587, 2.263, 1.837 and 1.779.
Commodities and Forex
Comex Gold –($1257.2) My monthly value level is $1179 8 with daily and weekly pivots at $1253.8 and $1251.6 and quarterly and annual risky levels at $1385.0, $1710.6, $1747.4, $1818.8 and $1857.1.
Nymex Crude Oil – ($97.82) Weekly and quarterly value levels are $95.66 and $93.35 with daily, semiannual, monthly and annual risky levels at $99.08, $104.97, $107.11 and $107.52.
The Euro – (1.3590) Daily, annual and semiannual value levels are 1.3466, 1.3382, 1.2642 and 1.2216 with quarterly and weekly pivots 1.3482 and 1.3538 and monthly risky level at 1.3880.
Major Indices
Daily Dow: (15,629) Daily and annual value levels are 15,436, 14,835 and 13,467 with monthly, weekly
and semiannual risky levels at 15,986, 16,224 and 16,245, the Dec. 31 all-time intraday high at
16,588.25 and quarterly and semiannual risky levels at 16,761 and 16,860.
S&P 500 – (1773.4) Annual value levels are 1539.1 and 1442.1 with daily and semiannual pivots at
1760.5, 1764.4 and 1797.3, weekly and monthly risky levels at 1817.8 and 1832.9, the Jan. 15 all-time
intraday high at 1850.84, and quarterly risky level at 1896.0.
NASDAQ – (4057) Semiannual and annual value levels are 3930, 3920, 3471 and 3063 with a daily
pivot at 4034, a weekly risky level at 4182, the Jan. 22 multiyear intraday high at 4246.55 and monthly
and quarterly risky levels at 4267 and 4274. Annual value levels are 3471 and 3063.
NASDAQ 100 (NDX) – (3498) Annual value levels are 3078 and 2669 with daily and semiannual pivots
at 3466, 3456 and 3458 and weekly and monthly risky levels at 3572 and 3639, the Jan. 22 multiyear
intraday high at 3634.65 and quarterly risky level at 3714.
Dow Transports – (7182) Annual value levels are 6249 and 5935 with daily, quarterly and semiannual
pivots at 7176, 7086, 7245 and 7376, monthly and weekly risky levels at 7412 and 7417, and the Jan.
23 all-time intraday high at 7591.43.
Russell 2000 – (1103.93) Annual value levels are 966.72 and 879.39 with daily and semiannual pivots
at 1101.12, 1133.29 and 1130.79, a weekly risky level at 1159.63, the Jan. 22 all-time intraday high at
1182.04 and quarterly and monthly risky levels at 1180.35 and 1189.18.
The SOX – (526.67) Semiannual and annual value levels are 490.52, 371.58 and 337.74 with a daily
pivot at 523.93, monthly, quarterly and weekly risky levels at 532.59, 536.98, 538.45, the Jan. 22
multiyear intraday high at 547.92, and semiannual risky level at 548.36.
Dow Utilities: (500.34) Annual, quarterly and weekly pivots are 497.53, 496.84 and 493.39 with daily,
monthly, semiannual and annual at risky levels at 506.35, 504.53, 504.74, 524.37 and 548.70.
Stock of the Day
One of the more popular features of Richard Suttmeier's Morning Briefing for investors is his stock of the day. In every issue, Suttmeier highlights one stock and provides VE data as well as his own proprietary technical data.
Here is today's stock of the day from Richard Suttmeier's Morning Briefing Newsletter.
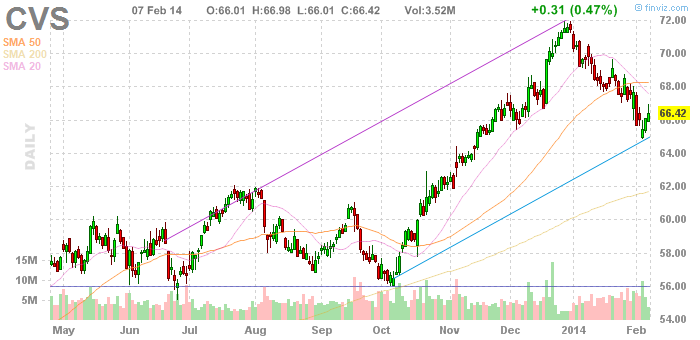
CVS Caremark (CVS) – ($66.10) CVS/Caremark is the nation's premier integrated pharmacy services provider,
combining one of the nation's leading pharmaceutical services companies with the country's largest pharmacy chain. The company fills or manages more than one billion prescriptions per year, more than any other pharmacy services provider. CVS/Caremark drives value for pharmacy services customers by effectively managing pharmaceutical costs and improving healthcare outcomes through its six thousand two hundred CVS/pharmacy stores; its pharmacy benefit management, mail order and specialty pharmacy division, Caremark Pharmacy Services; its retail-based health clinic subsidiary, MinuteClinic; and its online pharmacy, CVS.com.
Analysis – CVS Caremark has a buy rating according to ValuEngine and is 8.8% overvalued with fair value at $60.14 and one-year price target is $71.91. The daily chart shows oversold momentum with the stock below its 21-day and 50-day simple moving averages at $67.93 and $68.30 and above its 200-day simple moving average at $61.89. My annual value levels are $62.17 and $56.16 with a semiannual pivot at $65.09 and monthly and quarterly risky levels at $69.02 and $70.41.
Richard Suttmeier, Chief Market Strategist at ValuEngine.com & Contributor to TheStreet.com
Richard Suttmeier has been a professional in the US Capital Markets since 1972 transferring his engineering skills to the trading and investment world. He earned a Bachelor of Industrial Engineering degree from Georgia Institute of Technology in 1966, and a Master of Science, Operations Research, Systems Analysis degree from Brooklyn Polytechnic University in 1970. Over the years Richard appeared many times in the financial media, on networks such as CNBC, CNN, CNNfn, New York 1, Bloomberg TV and radio, Fox Business, Business News Network in Canada, Wall Street Week with Fortune, Yahoo Finance Breakout, and the Bill Mazer Radio Show. In 2002, he anchored his own show on Yahoo Finance Vision called, "Traders' Club with Richard Suttmeier." Richard has been frequently quoted in USA Today, The NY Times, Wall Street Journal, Reuters, and The Dow Jones Newswires. Richard has made numerous speaking appearances in recent years to groups such as the Market Technicians Associations, the American Association of Individual Investors, Wells Fargo Advisors, the Executive Forum at the National Arts Club, and the Investors Roundtable of Wilmington NC.
Now YOU can take advantage of the same market and trading expertise as the financial media with Richard Suttmeier's ValuTrader Model Portfolio
The ValuTrader Portfolio Newsletter is based on ValuEngine Chief Market Strategist Richard Suttmeier's proprietary market analytics. Suttmeier combines his technical analysis expertise with ValuEngine's proprietary valuation, forecast, and ratings data for more than 4000 equities trading on US markets to come up with a 20 stock portfolio tailored to current market conditions. With ValuTrader, subscribers access Suttmeier's "Buy and Trade" strategy with a portfolio designed to function well in both up and down markets.
Click HERE to Sign Up for Chief Market Strategist Richard Suttmeier's ValuTrader Model Portfolio
With Richard Suttmeier's Morning Briefing, you get daily analysis of US Treasury Yields, Gold, Crude Oil, and Currency Exchange Rates--Dollar, Yen, Pound, and Euro--as well as key technical indicators for the major equity averages. |
|
 |

If you no longer wish to receive this free newsletter, CLICK HERE to unsubscribe
|


