| |
Home |
About Us & VE Models |
Products & Sign Up |
My Account
|
|||
| ||||
 |
||||||||||||||||||||||||||||||||||||||||||||||||||||||||||||||||||||||||||||||||||||||||||||||||||||||||||||||||||||||||||||||||||||||||||||||||||||||||||||||||||||||||||||||||||||||||||||||||||||||||||||||||||||||||||||||||||||||||||||||||||||||||||||||||||||||||||||||||||||||||||||||||||||||||||||||||||||||||||||||||||||||||
ValuEngine Market Overview
ValuEngine Sector Overview
ValuEngine Newsletters Latest Results
ValuEngine's Newsletters Beat the Market Let ValuEngine Optimize your Portfolio and Provide Rational Advice for Smarter Investing Click HERE to Check Out ValuEngine's Investment Newsletters Free Download for ReadersAs a bonus to our Free Weekly Newsletter subscribers, Dollar General Corporation is a discount retailer in the United States. The Company separates its merchandise into four categories, which includes highly consumable, seasonal, home products and basic clothing. Highly consumable consists of packaged food, candy, snacks and refrigerated products, health and beauty aids, home cleaning supplies and pet supplies; seasonal consists of seasonal and holiday-related items, toys, stationery and hardware; home products consists of house wares and domestics, and basic clothing consists of casual everyday apparel. Dollar General is among the largest retailers of top-quality products made by America's most trusted manufacturers such as Procter & Gamble, Kimberly-Clark, Unilever, Kellogg's, General Mills, Nabisco, Fruit of the Loom, PepsiCo and Coca-Cola. The Company store support center is located in Goodlettsville, Tennessee. ValuEngine continues its BUY recommendation on DOLLAR GENERAL for 2014-01-09. Based on the information we have gathered and our resulting research, we feel that DOLLAR GENERAL has the probability to OUTPERFORM average market performance for the next year. The company exhibits ATTRACTIVE Sharpe Ratio and Company Size. Read our Detailed Valuation Report, a $25 value, for FREE HERE.
|
||||||||||||||||||||||||||||||||||||||||||||||||||||||||||||||||||||||||||||||||||||||||||||||||||||||||||||||||||||||||||||||||||||||||||||||||||||||||||||||||||||||||||||||||||||||||||||||||||||||||||||||||||||||||||||||||||||||||||||||||||||||||||||||||||||||||||||||||||||||||||||||||||||||||||||||||||||||||||||||||||||||||

Ticker |
Name |
Mkt Price |
Valuation(%) |
Last 12-M Retn(%) |
DCIX |
DIANA CONTAINER |
3.94 |
2.85 |
-41.02 |
TNP |
TSAKOS EGY NAVG |
6.52 |
-21.24 |
54.5 |
VLCCF |
KNIGHTSBRIDGE |
9.83 |
-1.71 |
57.53 |
NNA |
NAVIOS MARI ACQ |
4.46 |
30.48 |
74.22 |
ABFS |
ARKANSAS BEST |
33.47 |
50.52 |
243.99 |
Top-Five Transportation Stocks--Long-Term Forecast Returns
Ticker |
Name |
Mkt Price |
Valuation(%) |
Last 12-M Retn(%) |
DCIX |
DIANA CONTAINER |
3.94 |
2.85 |
-41.02 |
TNP |
TSAKOS EGY NAVG |
6.52 |
-21.24 |
54.5 |
VLCCF |
KNIGHTSBRIDGE |
9.83 |
-1.71 |
57.53 |
NNA |
NAVIOS MARI ACQ |
4.46 |
30.48 |
74.22 |
ABFS |
ARKANSAS BEST |
33.47 |
50.52 |
243.99 |
Top-Five Transportation Stocks--Composite Score
Ticker |
Name |
Mkt Price |
Valuation(%) |
Last 12-M Retn(%) |
TNP |
TSAKOS EGY NAVG |
6.52 |
-21.24 |
54.5 |
VLCCF |
KNIGHTSBRIDGE |
9.83 |
-1.71 |
57.53 |
SBLK |
STAR BULK CARRS |
13.09 |
-42.15 |
85.25 |
CPA |
COPA HLDGS SA-A |
157.69 |
16.02 |
59.09 |
CSX |
CSX CORP |
28.66 |
23 |
39.53 |
Top-Five Transportation Stocks--Most Overvalued
Ticker |
Name |
Mkt Price |
Valuation(%) |
Last 12-M Retn(%) |
XPO |
XPO LOGISTICS |
29.5 |
125.72 |
72.01 |
DHT |
DHT HOLDINGS |
7.21 |
123.84 |
60.94 |
NM |
NAVIOS MARI HLD |
9.69 |
123.81 |
157.71 |
VTNC |
VITRAN CORP INC |
6.47 |
121.45 |
7.48 |
DSX |
DIANA SHIPPING |
12.38 |
105.27 |
46.34 |
Find out what Wall Street Investment and Media Professionals already know,
ValuEngine offers sophisticated stock valuation and forecast research as well as a variety of portfolio screening and creation tools.
If you are reading this you should sign up for ValuEngine's award-winning stock valuation and forecast service
NO OBLIGATION, 30 DAY FREE TRIAL!To Sign Up for a FREE TRIAL, Please Click HERE

What's Hot
--VE Web Log (BLOG) Consolidates Content
We have added a blog to the VE Website. This new section consolidates all of our free content in one easily accessible location. Of special note is the work of our Chief Market Strategist Richard Suttmeier. Suttmeier, a prolific market analyst and commnetator, writes for forbes, thestreet.com, and many other investor websites. Check out our new blog page for one-stop access to all of his work as well as other bulletins and analysis based on ValUEngine's award-winning stock valuation and forecast services.
Check out our new blog page HERE
Suttmeier Says
--Commentary and Analysis from Chief Market Strategist Richard Suttmeier
If you have any comments or questions, send them to Rsuttmeier@Gmail.com 
Treasury Yields
10-Year--(2.962) My semiannual value level is 3.653 with daily and weekly pivots at 2.952 and 2.990 and quarterly, annual and semiannual risky levels at 2.628, 2.263, 1.837 and 1.779.
.
Commodities and Forex
Comex Gold –(3.871) My monthly value level is 4.505 with daily and weekly pivots at 3.873 and 3.894 and quarterly, annual and semiannual risky levels at 3.801, 3.283, 3.114, 3.107 and 2.624.
Comex Gold – ($1227.5) Weekly and monthly value levels are $1186.2 and $1112.1 with a daily pivot at $1232.1 and quarterly and annual risky levels at $1385.0, $1710.6, $1747.4, $1818.8 and $1857.1.
Nymex Crude Oil – ($92.36) My daily value level is $89.24 with a quarterly pivot at $93.35 and weekly, monthly, semiannual and annual risky levels at $97.46, $104.80, $104.97 and $107.52.
Major Indices
Daily Dow: (16,445) Monthly, semiannual and annual value levels are 16,327, 16,245, 14,835 and
13,467 with a daily pivot at 16,478, the Dec. 31 all-time intra-day high at 16,588.25, and weekly,
quarterly and semiannual risky levels at 16,578, 16,761 and 16,860.
S&P 500 – (1838.1) Daily, semiannual and annual value levels are 1832.2, 1797.3, 1764.4, 1539.1 and
1442.1 with a monthly pivot at 1847.0, the Dec.31 all-time intra-day high at 1849.44, and weekly and
quarterly risky levels at 1854.2, 1860.7 and 1896.0.
NASDAQ – (4156) Daily, semiannual and annual value levels are 4144, 3930, 3920, 3471 and 3063
with the Jan. 9 multi-year intra-day high at 4182.74 and weekly, monthly and quarterly risky levels at
4220, 4267 and 4274.
NASDAQ 100 (NDX) – (3553) Daily, semiannual and annual value levels are 3542, 3458, 3456, 3078
and 2669 the Dec. 31 multi-year intra-day high at 3592.00 and weekly, monthly and quarterly risky
levels at 3628, 3629 and 3714.
Dow Transports – (7380) Quarterly and annual value levels are 7086, 6249 and 5935 with
semiannual, daily and monthly pivots at 7245, 7376, 7305 and 7327, the Dec. 31 all-time intra-day high
at 7410.25, and weekly risky level at 7476.
Russell 2000 – (1158.34) Daily, semiannual and annual value levels are 1152.23, 1133.29, 1130.79,
966.72 and 879.39 with the Dec. 26 all time intra-day high at 1167.96, and weekly, quarterly and
monthly risky levels at 1176.06, 1180.35 and 1200.55.
The SOX – (531.49) Daily, semiannual and annual value levels are 530.26, 490.52, 371.58 and 337.74
with a weekly pivot at 532.43, the Jan. 9 multi-year intra-day high at 536.19, and quarterly, monthly and
semiannual risky levels at 536.98, 544.70 and 548.36.
Dow Utilities: (487.38) Daily, weekly and monthly value levels are 483.55, 474.55 and 440.53 with
quarterly, annual, semiannual and annual risky levels at 496.84, 497.53, 504.74, 524.37 and 548.70.
Stock of the Day
One of the more popular features of Richard Suttmeier's Morning Briefing for investors is his stock of the day. In every issue, Suttmeier highlights one stock and provides VE data as well as his own proprietary technical data.
Here is today's stock of the day from Richard Suttmeier's Morning Briefing Newsletter.
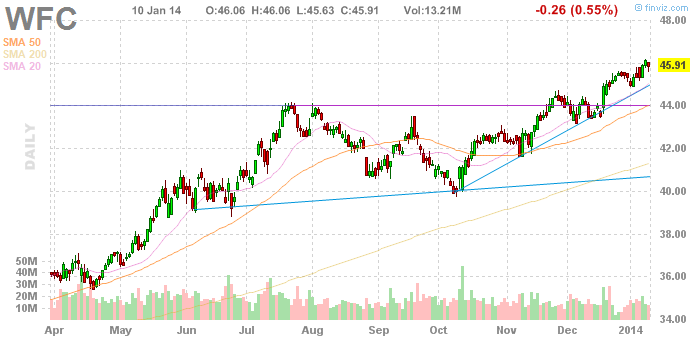
Wells Fargo (WFC) – ($46.16) Wells Fargo & Company is a diversified financial services company providing banking, insurance, investments, mortgage and consumer finance services through stores, its Internet site and other distribution channels across North America as well as internationally.
Analysis – Wells Fargo has a hold rating according to ValuEngine with fair value at $37.41 which makes the stock 22.8% overvalued, and a one-year price target at $47.03. The daily chart shows overbought momentum with the stock above its 21-day, 50-day and 200-day simple moving averages at $44.91, $44.01 and $41.69. My semiannual value levels are $42.32 and $40.96 with monthly and quarterly risky levels at $47.63 and $49.48.
Richard Suttmeier, Chief Market Strategist at ValuEngine.com & Contributor to TheStreet.com
Richard Suttmeier has been a professional in the US Capital Markets since 1972 transferring his engineering skills to the trading and investment world. He earned a Bachelor of Industrial Engineering degree from Georgia Institute of Technology in 1966, and a Master of Science, Operations Research, Systems Analysis degree from Brooklyn Polytechnic University in 1970. Over the years Richard appeared many times in the financial media, on networks such as CNBC, CNN, CNNfn, New York 1, Bloomberg TV and radio, Fox Business, Business News Network in Canada, Wall Street Week with Fortune, Yahoo Finance Breakout, and the Bill Mazer Radio Show. In 2002, he anchored his own show on Yahoo Finance Vision called, "Traders' Club with Richard Suttmeier." Richard has been frequently quoted in USA Today, The NY Times, Wall Street Journal, Reuters, and The Dow Jones Newswires. Richard has made numerous speaking appearances in recent years to groups such as the Market Technicians Associations, the American Association of Individual Investors, Wells Fargo Advisors, the Executive Forum at the National Arts Club, and the Investors Roundtable of Wilmington NC.
Now YOU can take advantage of the same market and trading expertise as the financial media with Richard Suttmeier's ValuTrader Model Portfolio
The ValuTrader Portfolio Newsletter is based on ValuEngine Chief Market Strategist Richard Suttmeier's proprietary market analytics. Suttmeier combines his technical analysis expertise with ValuEngine's proprietary valuation, forecast, and ratings data for more than 4000 equities trading on US markets to come up with a 20 stock portfolio tailored to current market conditions. With ValuTrader, subscribers access Suttmeier's "Buy and Trade" strategy with a portfolio designed to function well in both up and down markets.
If you no longer wish to receive this free newsletter, CLICK HERE to unsubscribe

Testimonials | Press & News | B2B Partners | Privacy & Security Statement | Disclaimer
Analyst research and earnings information provided by IBES. Financial data provided by CapitalIQ.
Copyright 1998-2010 ValuEngine Inc. All Rights Reserved.