February 14, 2014
The ValuEngine
Weekly is an Investor Education newsletter focused on the
quantitative approach to investing and the tools available
from ValuEngine.com. In today's fast-moving and globalized financial markets, it is easy to get overloaded with information.
The winners will adopt an objective, scientific,
independent and unemotional approach to investing. If you
are not yet a member of ValuEngine's stock analysis service,
sign up now for a free trial at www.valuengine.com!
If the tables, charts, or other content in this email version of the newsletter do not display properly, please download the HTML version from
ValuEngine.com HERE or the PDF version from SCRIBD.com HERE
If you no longer wish to receive this free newsletter,
CLICK HERE to unsubscribe |
VALUATION WARNING: Our models find that overvaluation is at levels typically seen when market pullbacks occur. Overvalued stocks now make up 82% of our stocks assigned a valuation and almost 44% of those equities are calculated to be overvalued by 20% or more. ALL sectors are again calculated to be overvalued by double digits.
ValuEngine Index Overview
|
|
|
|
|
|
DJIA |
15793.63 |
16027.59 |
233.96 |
1.48% |
-2.85% |
NASDAQ |
4125.12 |
4240.67 |
115.55 |
2.80% |
1.45% |
RUSSELL 2000 |
1116.58 |
1147.79 |
31.21 |
2.80% |
-1.56% |
S&P 500 |
1796.2 |
1829.83 |
33.63 |
1.87% |
-0.72% |
ValuEngine Market Overview
Summary of VE Stock Universe |
Stocks Undervalued |
17.98% |
Stocks Overvalued |
82.02% |
Stocks Undervalued by 20% |
5.23% |
Stocks Overvalued by 20% |
43.96% |
ValuEngine Sector Overview
ValuEngine Newsletters Latest Results
VE Newsletter |
Current Results |
S&P 500 |
Last Month Total |
S&P 500 |
Since Inception |
S&P 500 |
|
-7.36 |
-0.87 |
1.73 |
3.64 |
109.34 |
102.06 |
|
-0.02 |
0.31 |
0.33 |
1.54 |
11.84 |
17.51 |
|
-4.21 |
-0.81 |
8.43 |
1.95 |
45.69 |
33.02 |
|
-1.92 |
-0.76 |
1.17 |
1.83 |
98.93 |
62.81 |
ValuEngine's Newsletters Beat the Market
With our Investment Newsletters, Subscribers Harness the Power of all of ValuEngine.com's Extensively Tracked and Tested Portfolio Strategies in an Easy to Follow Format.
Let ValuEngine Optimize your Portfolio and Provide Rational Advice for Smarter Investing
Click HERE to Check Out ValuEngine's Investment Newsletters
Free Download for Readers
As a bonus to our Free Weekly Newsletter subscribers,
we are offering a FREE DOWNLOAD of one of our Stock Reports
Comcast Corp. (CMCSA), among the world's leading communication companies, provides basic cable, digital cable and high speed internet services that connect people to what's important in their lives. They are in the process of deploying digital video applications and high-speed Internet access service to expand the products available on their cable communications networks.
ValuEngine continues its HOLD recommendation on COMCAST CORP A for 2014-02-13. Based on the information we have gathered and our resulting research, we feel that COMCAST CORP A has the probability to ROUGHLY MATCH average market performance for the next year. The company exhibits ATTRACTIVE Company Size but UNATTRACTIVE Book Market Ratio.
Read our Detailed Valuation Report, a $25 value, for FREE HERE.
Sector Talk--Utilities
Below, we present the latest data on Utilities stocks from our Institutional software package (VEI). Top five lists are provided for each category. We applied some basic liquidity criteria--share price greater than $3 and average daily volume in excess of 100k shares.
Please Click Here to Download a FREE Demo of ValuEngine's Professional VEI Software Package.
Top-Five Utilities Stocks--Short-Term Forecast Returns
Ticker |
Name |
Mkt Price |
Valuation(%) |
Last 12-M Retn(%) |
CHC |
CHINA HYDRO-ADS |
3.4 |
N/A |
55.25 |
ELP |
COPEL-ADR PR B |
10.92 |
-35.12 |
-31.41 |
GNCMA |
GENL COMMS INC |
9.77 |
-1.18 |
22.43 |
PAM |
PAMPA ENERGIA |
4.27 |
N/A |
12.37 |
IDT |
IDT CORP-CL B |
17.2 |
N/A |
64.59 |
Top-Five Utilities Stocks--Long-Term Forecast Returns
Ticker |
Name |
Mkt Price |
Valuation(%) |
Last 12-M Retn(%) |
CHC |
CHINA HYDRO-ADS |
3.4 |
N/A |
55.25 |
ELP |
COPEL-ADR PR B |
10.92 |
-35.12 |
-31.41 |
GNCMA |
GENL COMMS INC |
9.77 |
-1.18 |
22.43 |
PAM |
PAMPA ENERGIA |
4.27 |
N/A |
12.37 |
IDT |
IDT CORP-CL B |
17.2 |
N/A |
64.59 |
Top-Five Utilities Stocks--Composite Score
Ticker |
Name |
Mkt Price |
Valuation(%) |
Last 12-M Retn(%) |
AES |
AES CORP |
14.49 |
2.48 |
27.78 |
ETR |
ENTERGY CORP |
64.43 |
0.81 |
1.21 |
EXC |
EXELON CORP |
29.4 |
-2.21 |
-6.93 |
FE |
FIRSTENERGY CP |
31.6 |
-16.57 |
-22.32 |
BIP |
BROOKFIELD INFR |
37.82 |
-0.79 |
-4.47 |
Top-Five Utilities Stocks--Most Overvalued
Ticker |
Name |
Mkt Price |
Valuation(%) |
Last 12-M Retn(%) |
VG |
VONAGE HOLDINGS |
4.53 |
91.66 |
67.16 |
OKE |
ONEOK INC |
60.05 |
62.45 |
25.23 |
XTEX |
CROSSTEX EGY LP |
30.93 |
54.82 |
69.48 |
SRE |
SEMPRA ENERGY |
92.9 |
52.74 |
21.71 |
NI |
NISOURCE INC |
34.77 |
43.78 |
27.92 |
Find out what Wall Street Investment and Media Professionals already know,
ValuEngine offers sophisticated stock valuation and forecast research as well as a variety of portfolio screening and creation tools.
What's Hot--Valuation Levels Dip with Market, but Now Inch Back Up
ValuEngine tracks more than 8000 US equities, ADRs, and foreign stock which trade on US exchanges. When EPS estimates are available for a given equity, our model calculates a level of mispricing or valuation percentage for that equity based on earnings estimates and what the stock should be worth if the market were totally rational and efficient--an academic exercise to be sure, but one which allows for useful comparisons between equities, sectors, and industries. Using our Valuation Model, we can currently assign a VE valuation calculation to more than 3600 stocks.
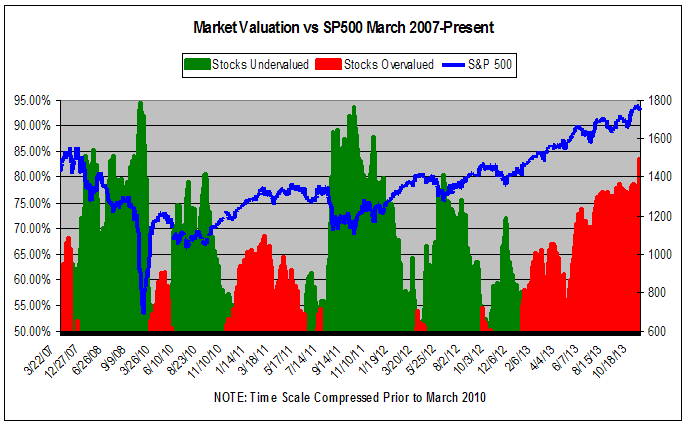
We combine all of the equities with a valuation calculation to track market valuation figures and use them as a metric for making calls about the overall state of the market. Two factors can lower these figures-- a market pullback, or a significant rise in EPS estimates. Whenever we see overvaluation levels in excess of @ 65% for the overall universe and/or 27% for the overvalued by 20% or more categories, we issue a valuation warning. We issued our latest valuation warning on May 8th. At that time, the S&P was at 1625.
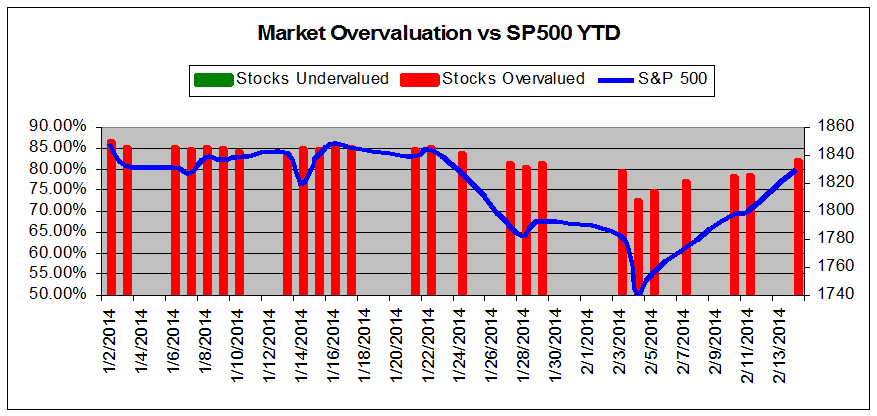
As of yesterday's close, we now calculate that 82% of stocks are overvalued and 44% of those stocks are overvalued by 20% or more. These levels remain high, but the recent market pull back did result in a dip in the metrics--the figure hit a 72.6% level for overvaluation when the S&P dropped to 1741 at the beginning of the month.
We believe that equities in the US still represent the only real game in town when it comes to yield, and we find numerous positive economic indicators for the US economy. However, tapering by the Fed will have an effect on stocks. And recent price declines driven by various emerging market crises reminds us all again of the interconnected nature of the world economy. We appreciate the fact----as the stock market seems to as well-- that the GOP in the US Congress learned its lesson when it comes to debt-ceiling shenanigans. A sense of relief on the street helped us overcome the recent doldrums and put a little bounce back on the board.
Investors are reminded to remain cautious against a move to the downside.
Keep a close eye on the market, set some stop losses to preserve gains, and consider booking some profits.
Subscribers Get FULL ACCESS to our Market and Sector Overviews
The chart below tracks the valuation metrics from January 2014.
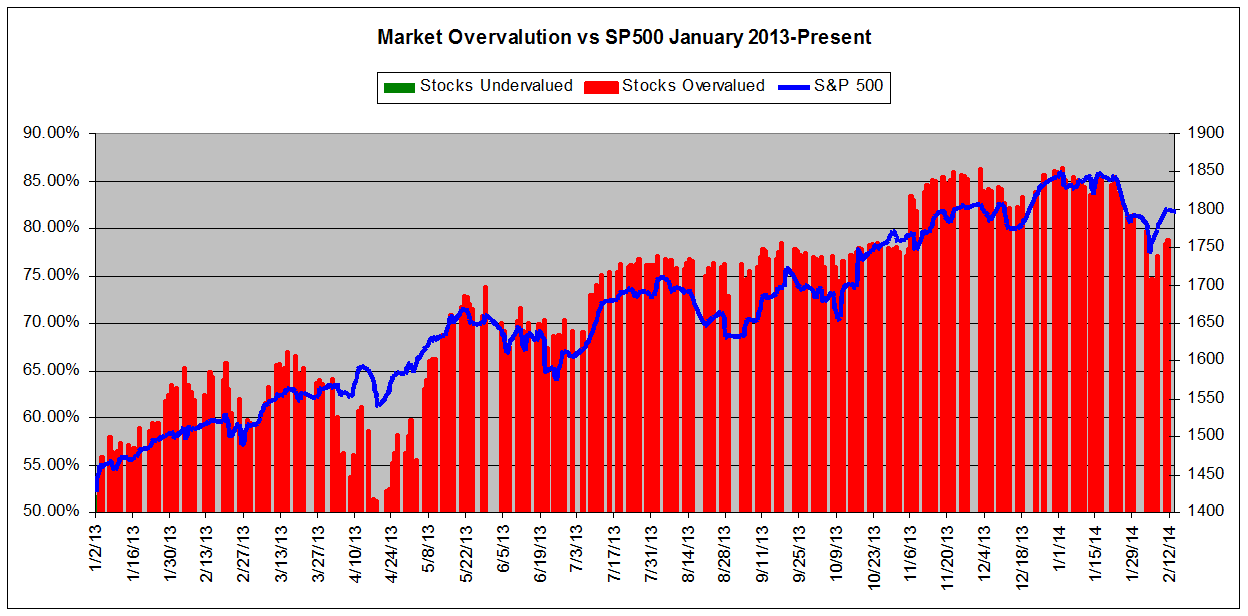
This chart shows overall universe under and over valuation in excess of 50% vs the S&P 500 from January 2013
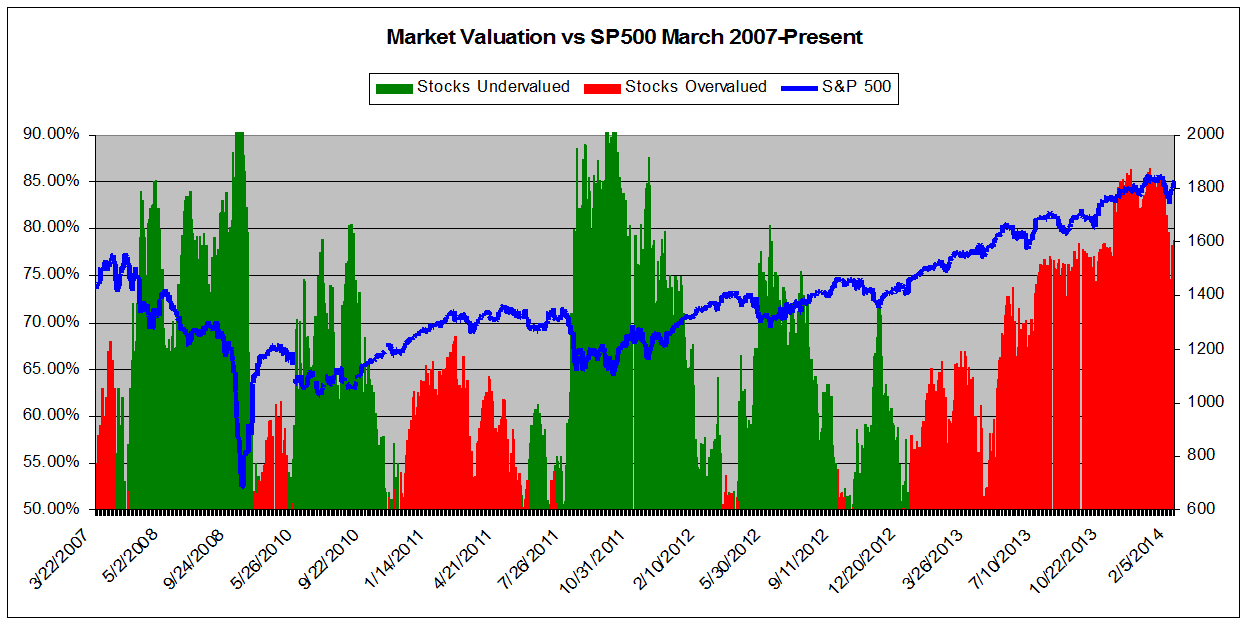
This chart shows overall universe under and over valuation in excess of 50% vs the S&P 500 from March 2007
In addition to the overall valuation metrics, we see that on a sector basis ALL sectors are calculated to be overvalued by double digits. In the past, our Chief Market Strategist Richard Suttmeier has used the sector valuation figures to buttress his macro market calls. This is another indicator that investors should consider implementing additional risk management tools and/or booking some profits.
VE Web Log (BLOG) Consolidates Content
We have added a blog to the VE Website. This new section consolidates all of our free content in one easily accessible location. Of special note is the work of our Chief Market Strategist Richard Suttmeier. Suttmeier, a prolific market analyst and commentator, writes for forbes, thestreet.com, and many other investor websites. Check out our new blog page for one-stop access to all of his work as well as other bulletins and analysis based on ValuEngine's award-winning stock valuation and forecast services.
Check out our new blog page HERE
Suttmeier Says
--Commentary and Analysis from Chief Market Strategist Richard Suttmeier
If you have any comments or questions, send them to Rsuttmeier@Gmail.com 
Treasury Yields
10-Year--(2.734) Daily and monthly value levels are 2.815 and 3.208 with quarterly and annual and semiannual risky levels at 2.628, 2.263, 1.837 and 1.779.
Commodities and Forex
Comex Gold –($1302.5) My monthly value level is $1179 8 with a daily pivot at $1298.0 and quarterly and annual risky levels at $1385.0, $1710.6, $1747.4, $1818.8 and $1857.1.
Nymex Crude Oil – ($100.30) My quarterly value level is $93.35 with daily, semiannual, monthly and
annual risky levels at $101.69, $104.97, $107.11 and $107.52.
The Euro – (1.3677) Quarterly, annual and semiannual value levels are 1.3482, 1.3382, 1.2642 and
1.2216 with a daily pivot at 1.3696 and monthly risky level at 1.3880.
Major Indices
Daily Dow: (16.028) Annual value levels are 14,835 and 13,467 with a monthly pivot at 15,986, daily
and semiannual risky levels at 16,210 and 16,245, the Dec. 31 all-time intraday high at 16,588.25 and
quarterly and semiannual risky levels at 16,761 and 16,860.
S&P 500 – (1829.8) Semiannual and annual value levels are 1797.3, 1764.4, 1539.1 and 1442.1 with
monthly and daily risky levels at 1832.9 and 1852.6, the Jan. 15 all-time intraday high at 1850.84, and
quarterly risky level at 1896.0.
NASDAQ – (4241) Semiannual and annual value levels are 3930, 3920, 3471 and 3063 with the Jan.
22 multiyear intraday high at 4246.55 and daily, monthly and quarterly risky levels at 4280, 4267 and
4274. Annual value levels are 3471 and 3063.
NASDAQ 100 (NDX) – (3660) Semiannual and annual value levels are 3456, 3458, 3078 and 2669
with a monthly pivot at 3639, the Feb. 13 multiyear intraday high at 3659.56 and daily and quarterly
risky levels at 3701 and 3714.
Dow Transports – (7282) Quarterly and annual value levels are 7086, 6249 and 5935 with semiannual
pivots at 7245 and 7376, daily and monthly risky levels at 7366 and 7412, and the Jan. 23 all-time
intraday high at 7591.43.
Russell 2000 – (1147.79) Annual value levels are 966.72 and 879.39 with semiannual and daily pivots
at 1133.29, 1130.79 and 1148.28, the Jan. 22 all-time intraday high at 1182.04 and quarterly and
monthly risky levels at 1180.35 and 1189.18.
The SOX – (556.02) Quarterly, monthly, semiannual and annual value levels are 536.98, 532.59,
490.52, 371.58 and 337.74 with a semiannual pivot at 548.36, the Feb. 13 multiyear intraday high at
556.04 and a daily risky level at 558.81.
Dow Utilities: (516.25) Daily, monthly, annual and quarterly value levels are 511.92, 504.53, 504.74,
497.53 and 496.84 with semiannual and annual risky levels at 524.37 and 548.70.
Stock of the Day
One of the more popular features of Richard Suttmeier's Morning Briefing for investors is his stock of the day. In every issue, Suttmeier highlights one stock and provides VE data as well as his own proprietary technical data.
Here is today's stock of the day from Richard Suttmeier's Morning Briefing Newsletter.
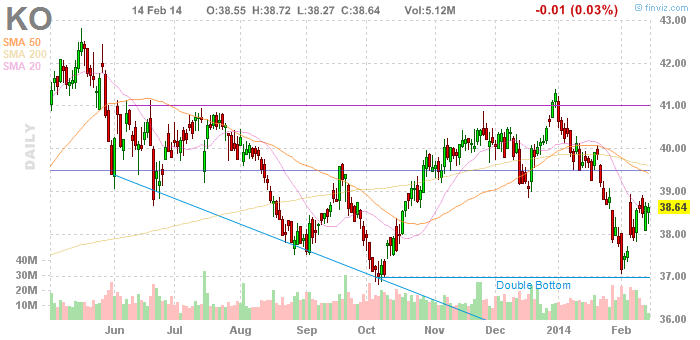
Coca Cola (KO) – ($38.65) The Coca-Cola Company is the world's largest beverage company and is the leading producer and marketer of soft drinks. Along with Coca-Cola, recognized as the world's bestknown brand, The Coca-Cola Company markets four of the world's top five soft drink brands, including diet Coke, Fanta and Sprite. Through the world's largest distribution system, consumers in nearly 200 countries enjoy The Coca-Cola Company's products at a rate of more than 1 billion servings each day.
Analysis – Coca Cola has a buy rating according to ValuEngine and is 2.7% overvalued with fair value at $37.49 and a one-year price target is $41.41. The daily chart shows rising momentum with the stockabove its 21-day simple moving average at $38.61 but below its 50-day and 200-day simple moving averages at $39.47 and $39.81. My annual value level is $27.63 with a monthly pivot at $38.45 and quarterly and semiannual risky levels at $43.64, $44.67 and $45.83.
Richard Suttmeier, Chief Market Strategist at ValuEngine.com & Contributor to TheStreet.com
Richard Suttmeier has been a professional in the US Capital Markets since 1972 transferring his engineering skills to the trading and investment world. He earned a Bachelor of Industrial Engineering degree from Georgia Institute of Technology in 1966, and a Master of Science, Operations Research, Systems Analysis degree from Brooklyn Polytechnic University in 1970. Over the years Richard appeared many times in the financial media, on networks such as CNBC, CNN, CNNfn, New York 1, Bloomberg TV and radio, Fox Business, Business News Network in Canada, Wall Street Week with Fortune, Yahoo Finance Breakout, and the Bill Mazer Radio Show. In 2002, he anchored his own show on Yahoo Finance Vision called, "Traders' Club with Richard Suttmeier." Richard has been frequently quoted in USA Today, The NY Times, Wall Street Journal, Reuters, and The Dow Jones Newswires. Richard has made numerous speaking appearances in recent years to groups such as the Market Technicians Associations, the American Association of Individual Investors, Wells Fargo Advisors, the Executive Forum at the National Arts Club, and the Investors Roundtable of Wilmington NC.
Now YOU can take advantage of the same market and trading expertise as the financial media with Richard Suttmeier's ValuTrader Model Portfolio
The ValuTrader Portfolio Newsletter is based on ValuEngine Chief Market Strategist Richard Suttmeier's proprietary market analytics. Suttmeier combines his technical analysis expertise with ValuEngine's proprietary valuation, forecast, and ratings data for more than 4000 equities trading on US markets to come up with a 20 stock portfolio tailored to current market conditions. With ValuTrader, subscribers access Suttmeier's "Buy and Trade" strategy with a portfolio designed to function well in both up and down markets.
Click HERE to Sign Up for Chief Market Strategist Richard Suttmeier's ValuTrader Model Portfolio
With Richard Suttmeier's Morning Briefing, you get daily analysis of US Treasury Yields, Gold, Crude Oil, and Currency Exchange Rates--Dollar, Yen, Pound, and Euro--as well as key technical indicators for the major equity averages. |
|
 |

If you no longer wish to receive this free newsletter, CLICK HERE to unsubscribe
|


