| |
Home |
About Us & VE Models |
Products & Sign Up |
My Account
|
|||
| ||||
 |
||||||||||||||||||||||||||||||||||||||||||||||||||||||||||||||||||||||||||||||||||||||||||||||||||||||||||||||||||||||||||||||||||||||||||||||||||||||||||||||||||||||||||||||||||||||||||||||||||||||||||||||||||||||||||||||||||||||||||||||||||||||||||||||||||||||||||||||||||||||||||||||||||||||||||||||||||||||||||||||||||||||||||||||||||||||||||||||||||||||||||||||||||||||||||||||||||||||||||||||||||||||||||||||||||||||||||||||||||||||||||||||||||||||||||||||||||||||||||||||||
Top-Five Medical Stocks--Long-Term Forecast Returns
Top-Five Medical Stocks--Composite Score
Top-Five Medical Stocks--Most Overvalued
Find out what Wall Street Investment and Media Professionals already know,
What's Hot--Suttmeier Nominated for Award by TheStreet.comValuEngine Chief Market Strategist Richard Suttmeier is a prolific contributor to TheStreet.com. His work has been nominated for two Sigma Delta Chi awards as part of that financial portal's content from 2013. The Sigma Chi Delta Awards are presented annually by the Society of Professional Journalists. They recognize excellence in journalism and reporting.
|
||||||||||||||||||||||||||||||||||||||||||||||||||||||||||||||||||||||||||||||||||||||||||||||||||||||||||||||||||||||||||||||||||||||||||||||||||||||||||||||||||||||||||||||||||||||||||||||||||||||||||||||||||||||||||||||||||||||||||||||||||||||||||||||||||||||||||||||||||||||||||||||||||||||||||||||||||||||||||||||||||||||||||||||||||||||||||||||||||||||||||||||||||||||||||||||||||||||||||||||||||||||||||||||||||||||||||||||||||||||||||||||||||||||||||||||||||||||||||||||||

Position |
Ticker |
Company Name |
Entry Price 12/18/13 |
Current Price |
Change |
%Change |
Sector |
Long 1 |
LMIA |
LMI AEROSPACE |
14.04 |
13.9 |
-0.14 |
-1.00 |
AEROSPACE |
Long 1 |
CTB |
COOPER TIRE |
22.03 |
24.61 |
2.58 |
11.71 |
AUTO TIRES TRUCKS |
Long 1 |
DQ |
DAQO NEW ENERGY |
33.35 |
44.71 |
11.36 |
34.06 |
BASIC MATERIALS |
Long 1 |
CCRN |
CROSS COUNTRY |
8.7 |
10.77 |
2.07 |
23.79 |
BUSINESS SERVICES |
Long 1 |
SSYS |
STRATASYS LTD |
118.46 |
124.29 |
5.83 |
4.92 |
COMPUTERS TECHNOLOGY |
Long 1 |
PGTI |
PGT INC |
9.5 |
11.05 |
1.55 |
16.32 |
CONSTRUCTION |
Long 1 |
LYV |
LIVE NATION ENT |
18.73 |
20.7 |
1.97 |
10.52 |
CONSUMER DISCRETIONARY |
Long 1 |
DF |
DEAN FOODS CO |
16.64 |
17.37 |
0.73 |
4.39 |
CONSUMER STAPLES |
Long 1 |
GCAP |
GAIN CAP HLDGS |
7.61 |
9.02 |
1.41 |
18.53 |
FINANCE |
Long 1 |
ERII |
ENERGY RECOVERY |
5.38 |
5 |
-0.38 |
-7.06 |
INDUSTRIAL PRODUCTS |
Long 1 |
RPRX |
REPROS THERAPEU |
18.06 |
21.48 |
3.42 |
18.94 |
MEDICAL |
Long 1 |
LXU |
LSB INDS INC |
35.07 |
37.12 |
2.05 |
5.85 |
MULTI-SECTOR CONGLOMERATES |
Long 1 |
WLT |
WALTER ENERGY |
14.56 |
14.15 |
-0.41 |
-2.82 |
OILS ENERGY |
Long 1 |
SVU |
SUPERVALU INC |
6.69 |
6.23 |
-0.46 |
-6.88 |
RETAIL WHOLESALE |
Long 1 |
TNP |
TSAKOS EGY NAVG |
5.5 |
7.44 |
1.94 |
35.27 |
TRANSPORTATION |
Long 1 |
CWCO |
CONSOLTD WATER |
14.08 |
13.94 |
-0.14 |
-0.99 |
UTILITIES |
LONG PORTFOLIO |
10.35 |
||||||
GSPC |
S&P500 |
1781 |
1845.89 |
64.89 |
3.64 |
||
--VE Web Log (BLOG) Consolidates Content
We have added a blog to the VE Website. This new section consolidates all of our free content in one easily accessible location. Of special note is the work of our Chief Market Strategist Richard Suttmeier. Suttmeier, a prolific market analyst and commnetator, writes for forbes, thestreet.com, and many other investor websites. Check out our new blog page for one-stop access to all of his work as well as other bulletins and analysis based on ValUEngine's award-winning stock valuation and forecast services.
Check out our new blog page HERE
Suttmeier Says
--Commentary and Analysis from Chief Market Strategist Richard Suttmeier
If you have any comments or questions, send them to Rsuttmeier@Gmail.com 
Treasury Yields
10-Year--(2.843) Weekly and monthly value levels are 3.042 and 3.653 with daily, quarterly,annual and semiannual risky levels at 2.820, 2.628, 2.263, 1.837 and 1.779.
Commodities and Forex
Comex Gold –($1242.2) Weekly and monthly value levels are $1177.9 and $1112.1 with a daily pivot at $1240.6 and quarterly and annual risky levels at $1385.0, $1710.6, $1747.4, $1818.8 and $1857.1.
Nymex Crude Oil – ($94.12) My daily value level is $92.57 with a quarterly pivot at $93.35 and weekly, monthly, semiannual and annual risky levels at $97.64, $104.80, $104.97 and $107.52.
The Euro – (1.3618) Quarterly, annual and semiannual value levels are 1.3482, 1.3382, 1.2642 and 1.2216 with monthly and daily pivots at 1.3658 and 1.3622 and weekly and annual risky levels at 1.3816 and 1.5512.
Major Indices
Daily Dow: (16,417) Monthly, semiannual and annual value levels are 16,327, 16,245, 14,835 and
13,467 with daily and weekly pivots at 16,425 and 16,476, the Dec. 31 all-time intraday high at
16,588.25 and quarterly and semiannual risky levels at 16,761 and 16,860.
S&P 500 – (1845.9) Weekly, semiannual and annual value levels are 1838.8, 1797.3, 1764.4, 1539.1
and 1442.1 with my monthly pivot at 1847.0, the Jan. 15 all-time intraday high at 1850.84, and daily
and quarterly risky levels at 1851.9 and 1896.0.
NASDAQ – (4219) Semiannual and annual value levels are 4199, 3930, 3920, 3471 and 3063 with a
weekly pivot at 4205, the Jan. 16 multiyear intraday high at 4219.28 and daily, monthly and quarterly
risky levels at 4241, 4267 and 4274.
NASDAQ 100 (NDX) – (3611) Semiannual and annual value levels are 3458, 3456, 3078 and 2669
with a weekly pivot at 3610, the Jan. 15 multiyear intraday high at 3615.70 and daily, monthly and
quarterly risky levels at 3622, 3629 and 3714.
Dow Transports – (7457) Semiannual, weekly, monthly, quarterly and annual value levels are 7376,
7245, 7370, 7327, 7086, 6249 and 5935 with the Jan.15 all-time intraday high at 7508.74 and a daily
risky level at 7583.
Russell 2000 – (1173.12) Semiannual and annual value levels are 1163.75, 1133.29, 1130.79, 966.72
and 879.39 with the Jan. 16 all-time intraday high at 1173.13, and daily, quarterly and monthly risky
levels at 1178.85, 1180.35 and 1200.55.
The SOX – (541.05) Quarterly, weekly, weekly, semiannual and annual value levels are 536.98,
531.54, 490.52, 371.58 and 337.74 with a monthly pivot at 544.70, the Jan. 15 multiyear intraday high
at 545.75, and daily and semiannual risky levels at 547.78 and 548.36.
Dow Utilities: (492.70) Weekly and monthly value levels are 469.97 and 440.53 with daily, quarterly,
annual, semiannual and annual risky levels at 496.83, 496.84, 497.53, 504.74, 524.37 and 548.70.
Stock of the Day
One of the more popular features of Richard Suttmeier's Morning Briefing for investors is his stock of the day. In every issue, Suttmeier highlights one stock and provides VE data as well as his own proprietary technical data.
Here is today's stock of the day from Richard Suttmeier's Morning Briefing Newsletter.
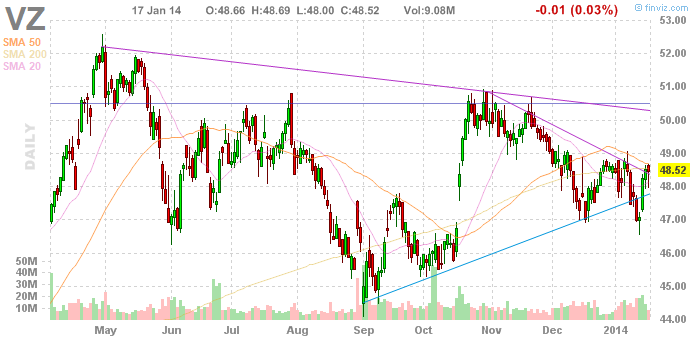
Verizon (VZ) – ($48.53) Verizon Communications, formed by the merger of Bell Atlantic and GTE, is one of the world's leading providers of high-growth communications services. Verizon companies are the largest providers of wireline and wireless communications in the United States. Verizon is also the world's largest provider of print and on-line directory information.
Analysis – Verizon has a buy rating according to ValuEngine with fair value at $50.32 which makes the stock 4.1% undervalued The one-year price target is $52.80. The daily chart shows rising momentum with the stock above its 21-day simple moving average at $48.42 but below its 50-day and 200-day simple moving averages at $49.17 and $49.60. My monthly value level is $44.04 with semiannual, annual and quarterly risky levels at $49.60, $50.75, $51.08 and $52.31.
Richard Suttmeier, Chief Market Strategist at ValuEngine.com & Contributor to TheStreet.com
Richard Suttmeier has been a professional in the US Capital Markets since 1972 transferring his engineering skills to the trading and investment world. He earned a Bachelor of Industrial Engineering degree from Georgia Institute of Technology in 1966, and a Master of Science, Operations Research, Systems Analysis degree from Brooklyn Polytechnic University in 1970. Over the years Richard appeared many times in the financial media, on networks such as CNBC, CNN, CNNfn, New York 1, Bloomberg TV and radio, Fox Business, Business News Network in Canada, Wall Street Week with Fortune, Yahoo Finance Breakout, and the Bill Mazer Radio Show. In 2002, he anchored his own show on Yahoo Finance Vision called, "Traders' Club with Richard Suttmeier." Richard has been frequently quoted in USA Today, The NY Times, Wall Street Journal, Reuters, and The Dow Jones Newswires. Richard has made numerous speaking appearances in recent years to groups such as the Market Technicians Associations, the American Association of Individual Investors, Wells Fargo Advisors, the Executive Forum at the National Arts Club, and the Investors Roundtable of Wilmington NC.
Now YOU can take advantage of the same market and trading expertise as the financial media with Richard Suttmeier's ValuTrader Model Portfolio
The ValuTrader Portfolio Newsletter is based on ValuEngine Chief Market Strategist Richard Suttmeier's proprietary market analytics. Suttmeier combines his technical analysis expertise with ValuEngine's proprietary valuation, forecast, and ratings data for more than 4000 equities trading on US markets to come up with a 20 stock portfolio tailored to current market conditions. With ValuTrader, subscribers access Suttmeier's "Buy and Trade" strategy with a portfolio designed to function well in both up and down markets.
Click HERE to Sign Up for Chief Market Strategist Richard Suttmeier's ValuTrader Model Portfolio
If you no longer wish to receive this free newsletter, CLICK HERE to unsubscribe

Testimonials | Press & News | B2B Partners | Privacy & Security Statement | Disclaimer
Analyst research and earnings information provided by IBES. Financial data provided by CapitalIQ.
Copyright 1998-2010 ValuEngine Inc. All Rights Reserved.