February 21, 2014
The ValuEngine
Weekly is an Investor Education newsletter focused on the
quantitative approach to investing and the tools available
from ValuEngine.com. In today's fast-moving and globalized financial markets, it is easy to get overloaded with information.
The winners will adopt an objective, scientific,
independent and unemotional approach to investing. If you
are not yet a member of ValuEngine's stock analysis service,
sign up now for a free trial at www.valuengine.com!
If the tables, charts, or other content in this email version of the newsletter do not display properly, please download the HTML version from
ValuEngine.com HERE or the PDF version from SCRIBD.com HERE
If you no longer wish to receive this free newsletter,
CLICK HERE to unsubscribe |
VALUATION WARNING: Our models find that overvaluation is at levels typically seen when market pullbacks occur. Overvalued stocks now make up 83% of our stocks assigned a valuation and 46% of those equities are calculated to be overvalued by 20% or more. ALL sectors are again calculated to be overvalued by double digits.
ValuEngine Index Overview
|
|
|
|
|
|
DJIA |
16153.97 |
16133.23 |
-20.74 |
-0.13% |
-2.79% |
NASDAQ |
4253.71 |
4267.55 |
13.84 |
0.33% |
2.11% |
RUSSELL 2000 |
1151.89 |
1162.12 |
10.23 |
0.89% |
0.22% |
S&P 500 |
1839.03 |
1839.78 |
0.75 |
0.04% |
-0.60% |
ValuEngine Market Overview
Summary of VE Stock Universe |
Stocks Undervalued |
16.57% |
Stocks Overvalued |
83.43% |
Stocks Undervalued by 20% |
4.7% |
Stocks Overvalued by 20% |
46.36% |
ValuEngine Sector Overview
ValuEngine Newsletters Latest Results
VE Newsletter |
Current Results |
S&P 500 |
Last Month Total |
S&P 500 |
Since Inception |
S&P 500 |
|
0.78 |
-0.05 |
-5.30 |
-0.28 |
98.25 |
101.50 |
|
0.72 |
0.85 |
0.33 |
1.54 |
11.84 |
17.51 |
|
-3.03 |
-0.28 |
8.43 |
1.95 |
45.69 |
33.02 |
|
-1.26 |
0.60 |
-0.58 |
-0.82 |
97.78 |
61.49 |
ValuEngine's Newsletters Beat the Market
With our Investment Newsletters, Subscribers Harness the Power of all of ValuEngine.com's Extensively Tracked and Tested Portfolio Strategies in an Easy to Follow Format.
Let ValuEngine Optimize your Portfolio and Provide Rational Advice for Smarter Investing
Click HERE to Check Out ValuEngine's Investment Newsletters
Free Download for Readers
As a bonus to our Free Weekly Newsletter subscribers,
we are offering a FREE DOWNLOAD of one of our Stock Reports
Amazon.com, Inc. (AMZN) serves consumers through its retail websites and focus on selection, price, and convenience. The Company offers programs that enables sellers to sell their products on its Websites and their own branded Websites and to fulfill orders through them , and programs that allow authors, musicians, filmmakers, application developers, and others to publish and sell content.
ValuEngine continues its BUY recommendation on AMAZON.COM INC for 2014-02-20. Based on the information we have gathered and our resulting research, we feel that AMAZON.COM INC has the probability to OUTPERFORM average market performance for the next year. The company exhibits ATTRACTIVE Company Size and Sharpe Ratio.
Read our Detailed Valuation Report, a $25 value, for FREE HERE.
Sector Talk--Consumer Staples
Below, we present the latest data on Consumer Staples stocks from our Institutional software package (VEI). Top five lists are provided for each category. We applied some basic liquidity criteria--share price greater than $3 and average daily volume in excess of 100k shares.
Please Click Here to Download a FREE Demo of ValuEngine's Professional VEI Software Package.
Top-Five Consumer Staples Stocks--Short-Term Forecast Returns
Ticker |
Name |
Mkt Price |
Valuation(%) |
Last 12-M Retn(%) |
DF |
DEAN FOODS CO |
14.56 |
5.09 |
-55.03 |
RIBT |
RICEBRAN TECH |
5.05 |
N/A |
-73.42 |
SAFM |
SANDERSON FARMS |
74.68 |
21.22 |
43.56 |
CAG |
CONAGRA FOODS |
28.56 |
-11.43 |
-15.13 |
AVP |
AVON PRODS INC |
15.04 |
-1.58 |
-26.53 |
Top-Five Consumer Staples Stocks--Long-Term Forecast Returns
Ticker |
Name |
Mkt Price |
Valuation(%) |
Last 12-M Retn(%) |
DF |
DEAN FOODS CO |
14.56 |
5.09 |
-55.03 |
RIBT |
RICEBRAN TECH |
5.05 |
N/A |
-73.42 |
SAFM |
SANDERSON FARMS |
74.68 |
21.22 |
43.56 |
CAG |
CONAGRA FOODS |
28.56 |
-11.43 |
-15.13 |
AVP |
AVON PRODS INC |
15.04 |
-1.58 |
-26.53 |
Top-Five Consumer Staples Stocks--Composite Score
Ticker |
Name |
Mkt Price |
Valuation(%) |
Last 12-M Retn(%) |
NUS |
NU SKIN ENTERP |
82.06 |
-17.81 |
104.23 |
PPC |
PILGRIMS PRIDE |
17.09 |
16.76 |
92.24 |
TAP |
MOLSON COORS-B |
56.13 |
9.51 |
25.85 |
LO |
LORILLARD CO |
48.22 |
6.08 |
14.08 |
CAG |
CONAGRA FOODS |
28.56 |
-11.43 |
-15.13 |
Top-Five Consumer Staples Stocks--Most Overvalued
Ticker |
Name |
Mkt Price |
Valuation(%) |
Last 12-M Retn(%) |
SNMX |
SENOMYX INC |
8.9 |
149.79 |
310.14 |
GMCR |
GREEN MTN COFFE |
123.74 |
113.85 |
170.41 |
NYT |
NY TIMES A |
14.74 |
72.92 |
63.23 |
HELE |
HELEN OF TROY |
63.22 |
70.22 |
71.65 |
BEAM |
BEAM INC |
83.21 |
53.68 |
35.39 |
Find out what Wall Street Investment and Media Professionals already know,
ValuEngine offers sophisticated stock valuation and forecast research as well as a variety of portfolio screening and creation tools.
VE Web Log (BLOG) Consolidates Content
We have added a blog to the VE Website. This new section consolidates all of our free content in one easily accessible location. Of special note is the work of our Chief Market Strategist Richard Suttmeier. Suttmeier, a prolific market analyst and commentator, writes for forbes, thestreet.com, and many other investor websites. Check out our new blog page for one-stop access to all of his work as well as other bulletins and analysis based on ValuEngine's award-winning stock valuation and forecast services.
Check out our new blog page HERE
Suttmeier Says
--Commentary and Analysis from Chief Market Strategist Richard Suttmeier
If you have any comments or questions, send them to Rsuttmeier@Gmail.com 
Treasury Yields
10-Year--(2.754) Daily and monthly value levels are 2.784 and 3.208 with a weekly pivot at 2.722 and quarterly and annual and semiannual risky levels at 2.628, 2.263, 1.837 and 1.779.
Commodities and Forex
Comex Gold –($1323.4) My monthly value level is $1179 8 with daily and weekly pivots at $1345.0 and $1324.0 and quarterly and annual risky levels at $1385.0, $1710.6, $1747.4, $1818.8 and $1857.1.
Nymex Crude Oil – ($102.83) Weekly and quarterly value levels are $95.53 and $93.35 with a daily pivot at $102.75, and semiannual, monthly and annual risky levels at $104.97, $107.11 and $107.52.
The Euro – (1.3718) Weekly, quarterly, annual and semiannual value levels are 1.3591, 1.3482, 1.3382, 1.2642 and 1.2216 with a daily pivot at 1.3739 and monthly risky level at 1.3880.
Major Indices
Daily Dow: (16.133) Annual value levels are 14,835 and 13,467 with monthly and weekly pivots at
15,986 and 16,118, semiannual and daily risky levels at 16,245 and 16,290, the Dec. 31 all-time
intraday high at 16,588.25 and quarterly and semiannual risky levels at 16,761 and 16,860.
S&P 500 – (1839.8) Semiannual and annual value levels are 1797.3, 1764.4, 1539.1 and 1442.1 with
weekly and monthly pivots at 1826.3 and 1832.9, the Jan. 15 all-time intraday high at 1850.84, and
daily and quarterly risky levels at 1859.8 and 1896.0.
NASDAQ – (4268) Semiannual and annual value levels are 3930, 3920, 3471 and 3063 with a weekly
pivot at 4230, monthly and quarterly pivots at 4267 and 4274, the Feb. 18 multiyear intraday high at
4277.33 and daily risky level at 4334. Annual value levels are 3471 and 3063.
NASDAQ 100 (NDX) – (3672) Weekly, semiannual and annual value levels are 3629, 3456, 3458,
3078 and 2669 with a monthly pivot at 3639, the Feb. 18 multiyear intraday high at 3685.18 and
quarterly and daily risky levels at 3714 and 3734.
Dow Transports – (7252) Quarterly and annual value levels are 7086, 6249 and 5935 with daily and
semiannual pivots at 7237 and 7245, semiannual, weekly and monthly risky levels at 7376, 7379 and
7412, and the Jan. 23 all-time intraday high at 7591.43.
Russell 2000 – (1162.12) Annual value levels are 966.72 and 879.39 with semiannual and weekly
pivots at 1133.29, 1130.79 and 1151.33, daily and quarterly risky levels at 1175.05 and 1180.35, the
Jan. 22 all-time intraday high at 1182.04 and a monthly risky level at 1189.18.
The SOX – (564.06) Weekly, quarterly, monthly, semiannual and annual value levels are 553.49,
536.98, 532.59, 490.52, 371.58 and 337.74 with a semiannual pivot at 548.36, the Feb. 20 multiyear
intraday high at 564.69 and a daily risky level at 574.94.
Dow Utilities: (523.12) Weekly, monthly, annual and quarterly value levels are 510.99, 504.53, 504.74,
497.53 and 496.84 with daily, semiannual and annual risky levels at 529.29, 524.37 and 548.70.
Stock of the Day
One of the more popular features of Richard Suttmeier's Morning Briefing for investors is his stock of the day. In every issue, Suttmeier highlights one stock and provides VE data as well as his own proprietary technical data.
Here is today's stock of the day from Richard Suttmeier's Morning Briefing Newsletter.
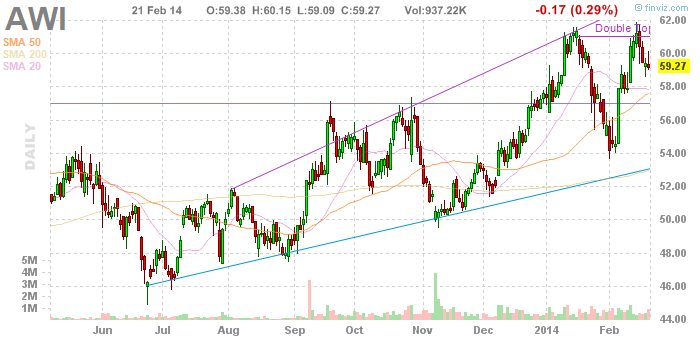
Armstrong World (AWI) – ($59.44) ARMSTRONG WORLD INDUSTRIES INC is a global leader in the design and manufacture of floors, ceilings and cabinets. Armstrongs consolidated net sales totaled approximately $3.5 billion. Based in Lancaster, Armstrong operates Forty plants in ten countries.
Analysis – Armstrong has a hold rating according to ValuEngine and is 10.8% overvalued with fair value at $53.73 and a one-year price target is $56.96. The daily chart shows overbought momentum with the stock above its 21-day, 50-day and 200-day simple moving averages at $58.01, $57.55 and $52.94. Semiannual and monthly value levels are $55.63 and $54.03 with a quarterly pivot at $60.33 and semiannual risky level at $73.92.
Richard Suttmeier, Chief Market Strategist at ValuEngine.com & Contributor to TheStreet.com
Richard Suttmeier has been a professional in the US Capital Markets since 1972 transferring his engineering skills to the trading and investment world. He earned a Bachelor of Industrial Engineering degree from Georgia Institute of Technology in 1966, and a Master of Science, Operations Research, Systems Analysis degree from Brooklyn Polytechnic University in 1970. Over the years Richard appeared many times in the financial media, on networks such as CNBC, CNN, CNNfn, New York 1, Bloomberg TV and radio, Fox Business, Business News Network in Canada, Wall Street Week with Fortune, Yahoo Finance Breakout, and the Bill Mazer Radio Show. In 2002, he anchored his own show on Yahoo Finance Vision called, "Traders' Club with Richard Suttmeier." Richard has been frequently quoted in USA Today, The NY Times, Wall Street Journal, Reuters, and The Dow Jones Newswires. Richard has made numerous speaking appearances in recent years to groups such as the Market Technicians Associations, the American Association of Individual Investors, Wells Fargo Advisors, the Executive Forum at the National Arts Club, and the Investors Roundtable of Wilmington NC.
Now YOU can take advantage of the same market and trading expertise as the financial media with Richard Suttmeier's ValuTrader Model Portfolio
The ValuTrader Portfolio Newsletter is based on ValuEngine Chief Market Strategist Richard Suttmeier's proprietary market analytics. Suttmeier combines his technical analysis expertise with ValuEngine's proprietary valuation, forecast, and ratings data for more than 4000 equities trading on US markets to come up with a 20 stock portfolio tailored to current market conditions. With ValuTrader, subscribers access Suttmeier's "Buy and Trade" strategy with a portfolio designed to function well in both up and down markets.
Click HERE to Sign Up for Chief Market Strategist Richard Suttmeier's ValuTrader Model Portfolio
With Richard Suttmeier's Morning Briefing, you get daily analysis of US Treasury Yields, Gold, Crude Oil, and Currency Exchange Rates--Dollar, Yen, Pound, and Euro--as well as key technical indicators for the major equity averages. |
|
 |

If you no longer wish to receive this free newsletter, CLICK HERE to unsubscribe
|


